𝗨𝗞 𝗣𝗿𝗼𝗽𝗲𝗿𝘁𝘆 𝗠𝗮𝗿𝗸𝗲𝘁 𝗨𝗽𝗱𝗮𝘁𝗲, 𝘄𝗸 𝗲𝗻𝗱𝗶𝗻𝗴 𝗦𝘂𝗻𝗱𝗮𝘆 𝟭𝟲𝘁𝗵 𝗙𝗲𝗯
This week's update provides a statistical analysis, offering insights into what’s happening and shaping the UK Property Market, week ending 16th February 2025.
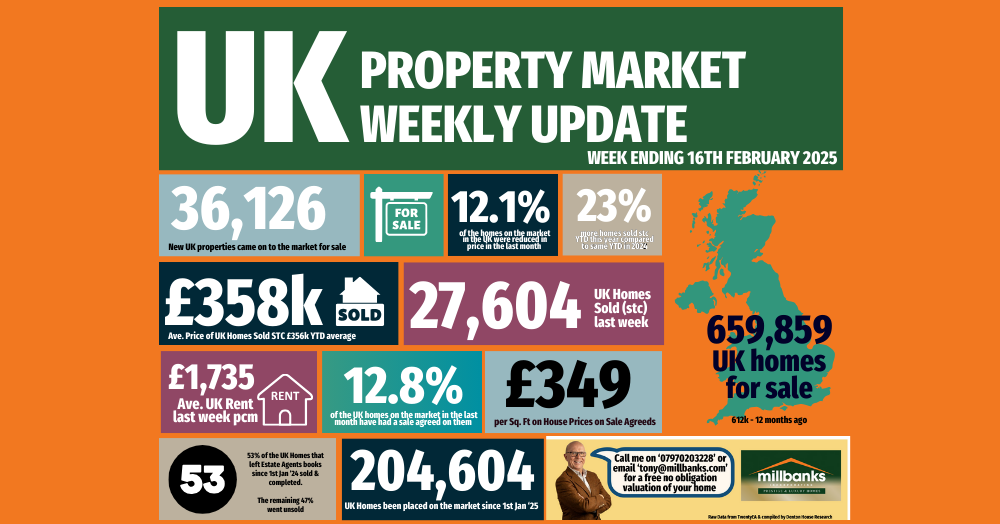
Hello everyone, and here are 𝗧𝗵𝗲 𝗨𝗞 𝗣𝗿𝗼𝗽𝗲𝗿𝘁𝘆 𝗠𝗮𝗿𝗸𝗲𝘁 𝗦𝘁𝗮𝘁𝘀 𝗳𝗼𝗿 𝘁𝗵𝗲 𝘄𝗲𝗲𝗸 𝗲𝗻𝗱𝗶𝗻𝗴 𝗦𝘂𝗻𝗱𝗮𝘆 𝟭𝟲𝘁𝗵 𝗙𝗲𝗯𝗿𝘂𝗮𝗿𝘆 𝟮𝟬𝟮𝟱.
✅ 𝗟𝗶𝘀𝘁𝗶𝗻𝗴𝘀 (𝗡𝗲𝘄 𝗣𝗿𝗼𝗽𝗲𝗿𝘁𝗶𝗲𝘀 𝗼𝗻 𝘁𝗵𝗲 𝗠𝗮𝗿𝗸𝗲𝘁)
36.1k new listings this week (last week 36.5k)
That’s 9% higher than Week 6 of 2024 YTD and 10% higher YTD compared to 2017/18/19.
✅ 𝗣𝗿𝗶𝗰𝗲 𝗥𝗲𝗱𝘂𝗰𝘁𝗶𝗼𝗻𝘀 (% 𝗼𝗳 𝗥𝗲𝘀𝗶 𝗦𝘁𝗼𝗰𝗸)
21.3k Price Reductions this week - meaning an approx run rate of 1 in 8 of Resi Sales stock per month is being reduced (12%).
For comparison, 11.9% average in 2024, though the long-term 5-year average is 10.6%.
✅ 𝗧𝗼𝘁𝗮𝗹 𝗚𝗿𝗼𝘀𝘀 𝗦𝗮𝗹𝗲𝘀 (𝗔𝗴𝗿𝗲𝗲𝗱 𝗦𝗮𝗹𝗲𝘀)
27.6k UK homes sold STC this week, up from 27k last week in Week 5
That’s 21% higher YTD compared to 2024 and 30% higher than 2017/18/19 YTD levels.
✅ 𝗦𝗮𝗹𝗲-𝗧𝗵𝗿𝗼𝘂𝗴𝗵 𝗥𝗮𝘁𝗲 (𝗠𝗼𝗻𝘁𝗵𝗹𝘆 𝗶𝗻 𝗔𝗿𝗿𝗲𝗮𝗿𝘀)
January’s Run rate of 15% of Resi stock sold stc. For comparison, 13.9% of residential sales stock sold in January 2025. 2024 monthly average: 15.3%. Long-term 8-year average: 17.9%.
✅ 𝗦𝗮𝗹𝗲 𝗙𝗮𝗹𝗹-𝗧𝗵𝗿𝗼𝘂𝗴𝗵𝘀
6,162 Sale fall-thrus last week from Resi Sale Sales Pipeline of 440,431 homes sale agreed (sold stc).
Another method is that week’s sale fall thrus as a % of gross sales that week. This week, that is 22.2% (last week 23.7%). Still slightly below the 7-year average of 24.2%, but well below the 40%+ levels post-Truss Budget (Autumn 2022).
For January ’25 as a whole, 6.03% of sales in the UK agents pipelines fell thru in Jan 25. For comparison, 2024 average: 5.36%.
✅ 𝗡𝗲𝘁 𝗦𝗮𝗹𝗲𝘀 (𝗚𝗿𝗼𝘀𝘀 𝘀𝗮𝗹𝗲𝘀 𝗳𝗼𝗿 𝘁𝗵𝗲 𝘄𝗲𝗲𝗸 𝗹𝗲𝘀𝘀 𝗦𝗮𝗹𝗲 𝗙𝗮𝗹𝗹 𝗧𝗵𝗿𝘂𝘀 𝗳𝗼𝗿 𝘁𝗵𝗲 𝘄𝗲𝗲𝗸)
21.4k net sales this week, compared 2025 weekly average of 20.7k. Last week
Week 5 2025 - 20.6k. 18.9k is the weekly YTD 2025 average.
2025 YTD is 19% higher than compared to 2024 YTD and 24% higher than YTD 2017/18/19.
𝙘𝙤𝙢𝙥𝙞𝙡𝙚𝙙 𝙗𝙮 𝙋𝙧𝙤𝙥𝙚𝙧𝙩𝙮𝙎𝙩𝙖𝙩𝙤 𝘾𝙝𝙧𝙞𝙨 𝙒𝙖𝙩𝙠𝙞𝙣 𝙪𝙨𝙞𝙣𝙜 𝙏𝙬𝙚𝙣𝙩𝙮𝙀𝘼 𝘿𝙖𝙩𝙖
If you’re interested to move and want a reliable, professional approach to selling your home in 2025, I'm here to help. Let's work together to make your property stand out in Attleborough's market, and attract motivated buyers to ensure a smooth sale from start to finish.
Get in touch with me today to learn more about my tailored advice and marketing strategy to sell your Attleborough home.
𝗖𝗮𝗹𝗹 𝗺𝗲 𝗼𝗻 (𝟬𝟭𝟵𝟱𝟯) 𝟰𝟱𝟯𝟴𝟯𝟴 𝗼𝗿 𝟬𝟳𝟵𝟳𝟬𝟮𝟬𝟯𝟮𝟮𝟴 𝗼𝗿 𝗱𝗿𝗼𝗽 𝗺𝗲 𝗮𝗻 𝗲𝗺𝗮𝗶𝗹 𝘁𝗼 𝘁𝗼𝗻𝘆@𝗺𝗶𝗹𝗹𝗯𝗮𝗻𝗸𝘀.𝗰𝗼𝗺
🏡🏠🏘️ #PersonalAgent #PropertyProfessionals #HelpingPeopleMoveHome