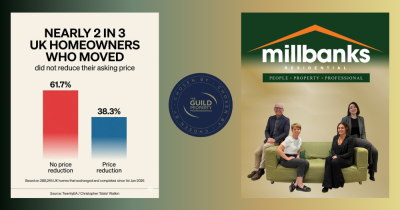
Too many homeowners believe they can start high and reduce later if needed. The reality is very different. New 2026 market data shows that nearly two in three successful sellers achieved their asking price without a reduction. Here's why accurate pricing from day one gives you the best chance of securing a successful move. Click to learn more...

Selling a home in today’s market requires experience, insight and a clear strategy. Between January and July 2026, Millbanks has successfully helped numerous homeowners and buyers across NR17, NR16 and NR9 achieve their objectives. In this article, we share our latest results, the approach behind them, and why our service continues to deliver.

The UK ranks 29th in Europe for homeownership at 65%, trailing far behind Eastern Europe’s 85%+. Despite rising deposits and affordability hurdles, the British dream of owning a home remains a powerful symbol of security. We explore why homeownership is changing and why the desire to own is still as strong as ever.
Every home has a story, from first steps to retirement dreams. Property isn't just bricks and mortar; it’s about people, timing, and local confidence. Whether you’re upsizing, downsizing, or just keeping watch, understanding our unique market is key. We look beyond the data to see what’s really happening in our local community.
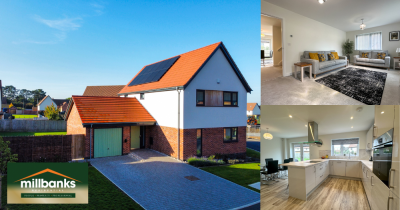
Considering a move to East Harling? Join us for an in-depth exploration of 22 Mount Pleasant Drive, a charming modern three-bedroom detached house that could be your perfect next chapter. Let's uncover what makes this property a compelling choice for buyers.
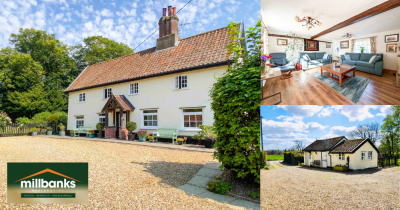
Check Out This Video - A Grade II Listed Cottage with a Detached 1 Bed Cottage/Annexe on 1 Acre Plot
Discover this exceptional 5-bedroom Grade II Listed detached character cottage in Norfolk, set on approximately one acre. Featuring a main house with 4 bedrooms, 2 reception rooms, and a stylish kitchen, plus a self-contained 1-bedroom cottage/annexe, extensive gardens, and a gated driveway.

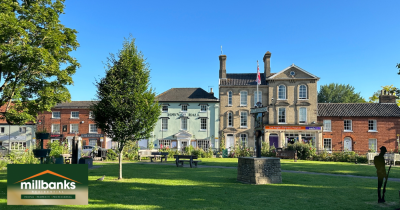
Britain is a nation of suburbs, with nearly 60% of us choosing family estates and cul-de-sacs over city centres. In Attleborough, this demand for gardens, community, and connectivity powers our local market. If you want to know what buyers are really looking for or how your home fits in, click the article link to learn more..
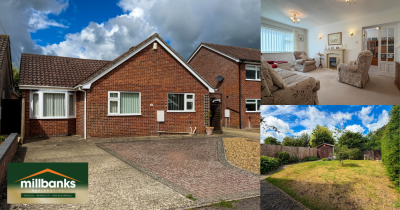
Discover this super detached 3-bedroom bungalow being offered with no onward chain. Featuring two separate reception rooms, a fitted kitchen, conservatory, modern shower room, and an enclosed west-facing garden, it offers comfortable living with off road car parking at the front of the property
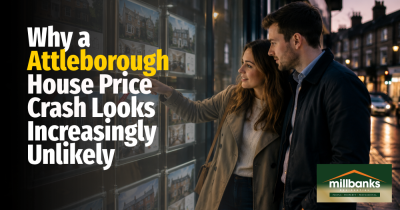
Ignore the crash headlines. Attleborough’s market is adjusting, not collapsing. With local unemployment at 2.3% and 46.9% of homes already sold (SSTC), demand remains resilient. Sales take an avrge 87 days—a return to a normal market where pricing is key. It’s a slow adjustment, not a disaster. Discover why the 'supertanker' is simply slowing down.
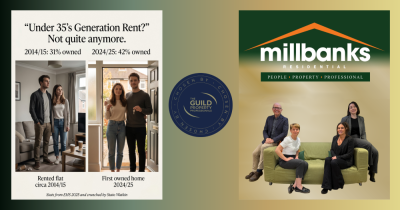
The "Generation Rent" narrative is shifting. New data shows under-35 homeownership jumped from 31% to 42% in a decade, while it actually fell for those aged 35-64. While affordability is still a hurdle, the dream of owning a home is far from dead for the youth. Is "Generation Rent" getting older? We explore the changing property landscape.

We have recently updated our Privacy Policy to provide greater clarity on how we collect, use, store and protect your personal information. We remain committed to handling your data responsibly and transparently, ensuring you understand your rights and how we safeguard your privacy.

How much are buyers paying per square foot in Attleborough? While this figure does not reflect house price changes on its own, it offers a valuable snapshot of the local market. Tracking £/sq.ft each month helps reveal changing trends and provides useful insight for homeowners, buyers and landlords alike.