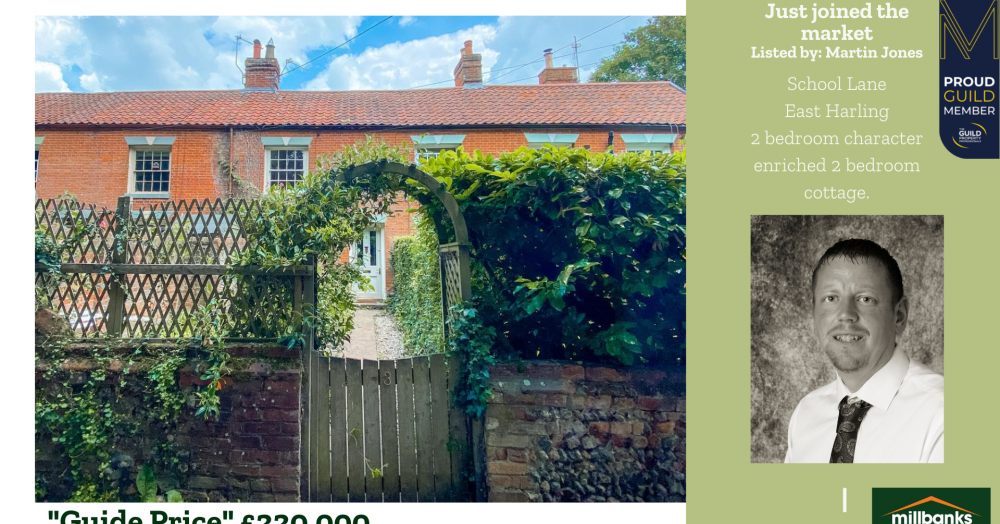
A 2 bedroom mid terraced cottage located less than 5 minutes walk to the centre of East Harling.


Private renting has grown across every UK region over the last 40 years, but the scale and pace are often misunderstood. This graphic shows how uneven that growth has been, shaped largely by the decline in social housing. Understanding this shift helps explain today’s housing balance and the choices ahead.
This map highlights the average size of homes sold across the UK since 2020, measured in square feet from completed sales. What stands out is how little the averages vary between regions, despite very different housing types. Northern Ireland is the clear exception, with noticeably larger homes on average.
This map highlights how uneven UK house price growth has been over the last decade. While some regions have surged ahead, others have seen far more modest gains. It’s a clear reminder that national averages hide wide regional differences, and that property performance is always shaped by local markets rather than headlines.
UK home sales agreed in 2025 tell a story of steady progress rather than drama. Many regions are seeing uplift thanks to realistic pricing and strong demand, while others are adjusting to affordability and expectations. The market is functioning, confident, and increasingly shaped by local conditions.