Analysis of Trends in UK Property Ownership (1918-2023)
The UK property market has seen significant changes over the last century, with distinct trends emerging in the areas of owner-occupied properties, social renting, and private renting.
The UK property market has seen significant changes over the last century, with distinct trends emerging in the areas of owner-occupied properties, social renting, and private renting.
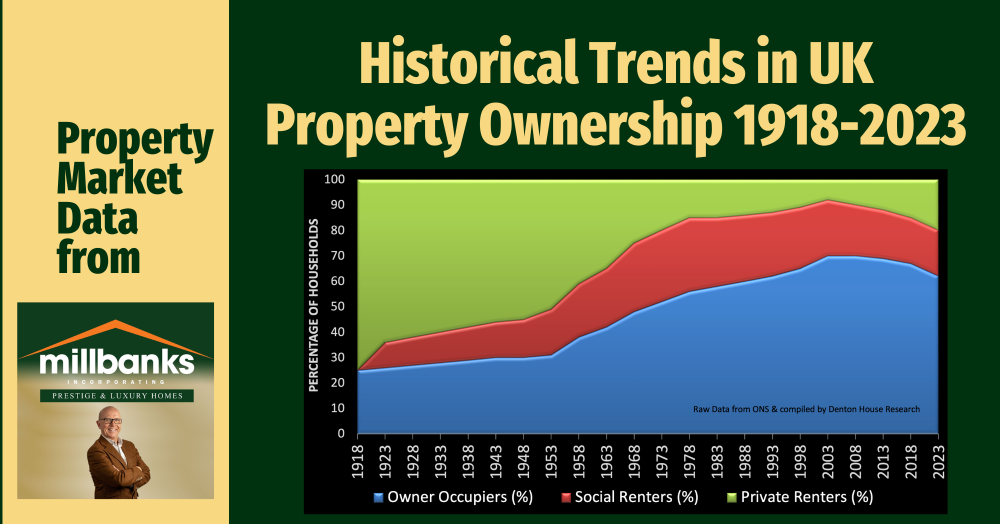
In 1918, the UK property landscape was dominated by private renters, who made up 75% of all households. At the time, only 25% of the population owned their own homes. Over the next few decades, home ownership gradually increased, reaching about 38% by 1958. This shift was accompanied by a decrease in private renting, which fell to 41% during the same period.
The most significant growth in home ownership occurred between 1958 and 2003, where the percentage of owner-occupiers surged from 38% to 70%. This period saw a corresponding decline in both private renting, which fell to just 8% in 2003, and social renting, which peaked at 29% in 1978 before declining to 22% by 2003.
Interestingly, the trend for private renting reversed around the time of the global financial crisis. Between 2003 and 2008, private renting began to grow again, rising from 8% to 10% of households. This growth continued, reaching 20% by 2023. This resurgence in private renting may be attributed to various factors, including increased housing demand, affordability challenges in the homeownership market, and changes in government housing policies.
Meanwhile, social renting has seen a gradual decline since its peak in the late 1970s, stabilising around 18% in recent years. The reduction in social housing reflects broader changes in government policy and the gradual shift towards promoting homeownership and the private rental sector.
In summary, the UK property market has evolved significantly over the past century. The initial dominance of private renting has given way to an increase in homeownership, although recent years have seen a renewed growth in the private rental market.
As an Attleborough estate agent, it’s important to recognise these trends and consider how they may impact local homeowners and landlords alike. The current levels of private renting and homeownership resemble those seen in the 1970s and 1990s, respectively, highlighting the cyclical nature of the property market.
Understanding these trends can provide valuable insights for making informed decisions in the current property landscape