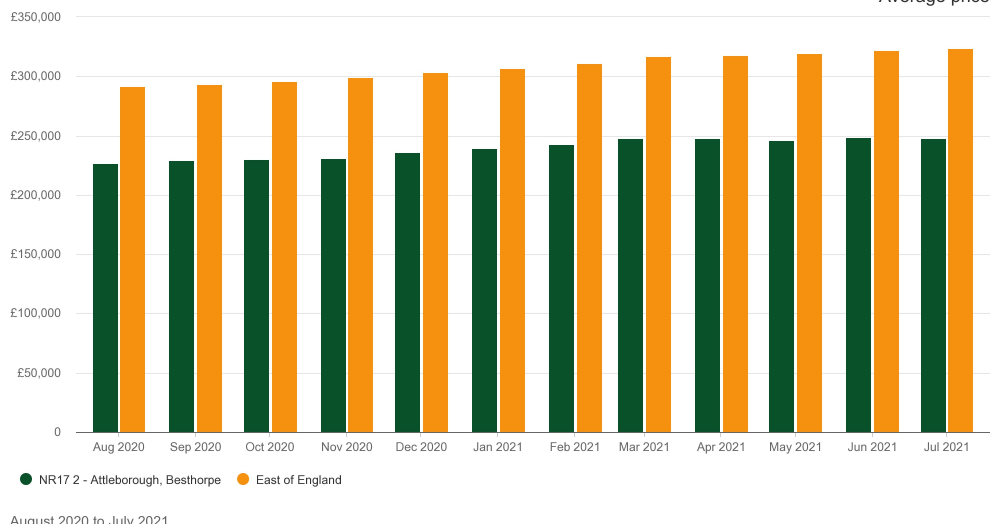
Average House Prices over the last 12 Months
With stock levels low and demand for housing remaining high we take a look over the last 12 months of each property type sold and their average prices achieved in our local area , the East of England and in England and Wales.


Want to know what your property is worth?
Find out in 60 seconds by clicking here