Fascinating the bad news the newspapers are giving, yet the figures tell a different story.
A comparison look at this last week’s property statistics compared to a year ago
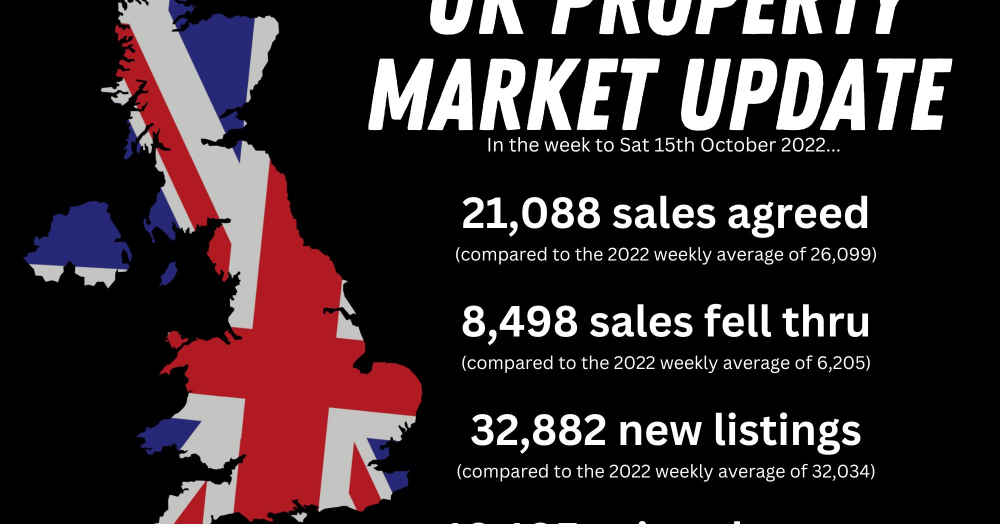
In the week to Sat 15th October 2022...
21,088 properties had sales agreed on them (compared to the 2022 weekly average of 26,099)
8,498 sales fell thru (compared to the 2022 weekly average of 6,205)
32,882 new properties came to onto the market (compared to the 2022 weekly average of 32,034)
19,195 price change (compared to the 2022 weekly average of 11,144)
So number of properties selling is slightly below, yet the first half of 2022 was silly, number of sales falling thru is slightly higher. The increase looks bad, yet when you think there are 428,000 properties in the UK that are sale agreed at this moment in time - nothing massive there.
No flood of properties entering the market (panic selling that will drop house prices)
Maybe its not as doom as gloom as people think?