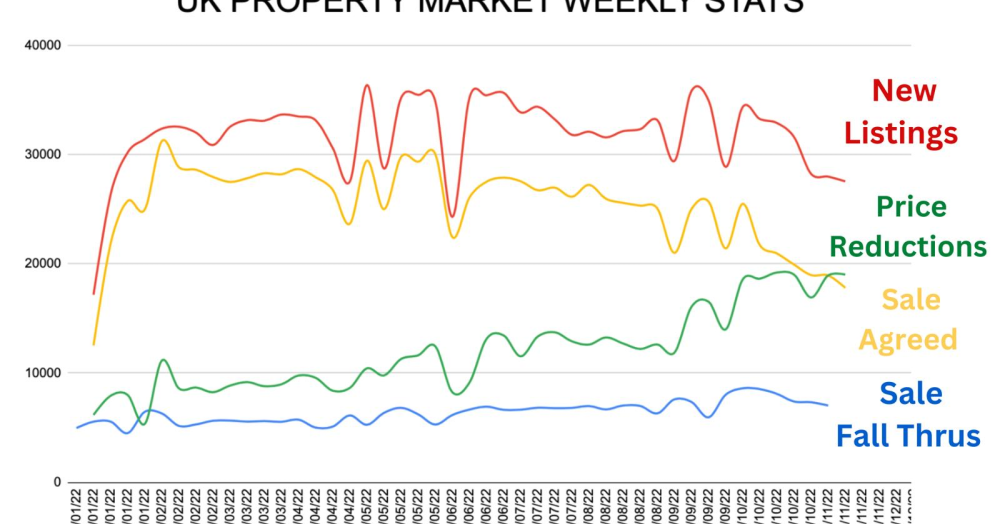
Here's your weekly snap shot of the UK Property Market

Here's your weekly snap shot of the UK Property Market

In this short article we reflect on the latest statistics from the UK Property Market and what this means for Homeowners and Landlords

This graph shows the number of weekly house sales in the U.K. (yellow line) dropping - if this was in a newspaper it would be doom and gloom

Yet with all things like this, the devil is in the detail

2020 and 2021 were exceptional years for the U.K. property market 

In Q4 2020, an average of 23,071 properties sold per week in the UK

In Q4 2021, an average of 21,051 properties sold per week in the UK

So with the average at 19,694 per week Quarter to date .. surely we should run for the hills?

Until you look at the averages for 2019

In Q4 2019, 16,263 properties sold per week sold

In Q4 2018, 15,922 properties sold per week sold

In Q4 2017, 15,721 properties sold per week sold

In Q4 2016, 15,811 properties sold per week

We are just going back to the ways things were before lockdown.

If you are a homeowner or landlord, don’t believe what the newspapers are putting out and look at what is really happening

Don't get me wrong, house prices will be lower next year (good I say)

Its going to hard work in 2023 .. but its not Armageddon like the papers say

SOURCE: Stats compiled by Chris Watkin using data from Twenty EA

To learn more and seek advice about the different selling strategies we use for selling homes in a difficult market, then please contact us here at Millbanks on (01953) 453838 or email info@millbanks.com
"We have been selling homes for nearly 40 years and have lots of industry-wide experience for providing great selling and marketing advice for difficult markets"

Kind regards 

Millbanks of Attleborough, Norfolk.


Get in touch with us

Do you own a leasehold property? Do you know how much is left on your lease? Read this article to learn more about why you should know how long is left, particularly before you try to sell.

Buying your first home is an exciting milestone, but navigating the world of mortgages can feel a bit overwhelming. With so many options available, how do you know you're getting the best deal? One crucial tip: don’t settle for the first offer—shop around!

Since 2014, UK house prices have climbed by 65.4%, but this national figure masks the varied growth across regions. In places like Attleborough, property values reflect distinct local factors, leading to differences in growth rates from city to city and town to town.

The graphic illustrates the staggering percentage increases in house prices across various regions of the UK over the last 50 years. The data, sourced from Land Registry, Denton House Research and Nationwide, sheds light on how each part of the UK has seen unprecedented growth.