Homes for Sales in March 2024 vs March 2023
The UK housing market is bustling with activity as shown in our latest March 2024 property market data, revealing some changes from just a year ago in March 2023.
The UK housing market is bustling with activity as shown in our latest March 2024 property market data, revealing some changes from just a year ago in March 2023.
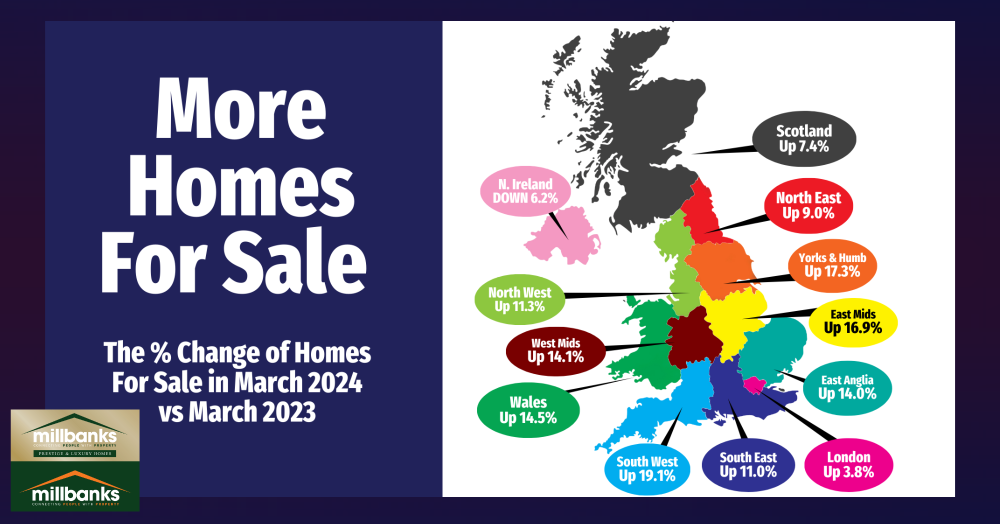
There's a notable uptick across the board, except for Northern Ireland, which experienced a 6.2% decrease.
Yet, the spotlight for properties on the market shines on the South West, boasting an impressive 19.1% increase, heralding a significant influx of homes on the market. Wales and the East Midlands aren’t far behind, with increases of 14.5% and 16.9%, respectively, signalling a promising variety of new homes to live in for prospective buyers.
Scotland and London present contrasting scenes; Scotland sees a 7.4% rise while London shows a modest 3.8% climb, perhaps reflecting the capital’s already saturated market. The North East, North West, and Yorkshire & the Humber regions are also flourishing with 9%, 11.3%, and 17.3% increases, respectively, suggesting a robust expansion in choices for those seeking new beginnings.
For those enchanted by East Anglia, there's a 14% growth, and the West Midlands isn't far off with a 14.1% bump. The South East also shows a healthy 11% rise, further adding to the broadening landscape of options.
With more homes on the market, Attleborough homeowners, landlords, and future residents now have a wider selection to find their perfect dwelling, possibly the forever home they've been dreaming of. If you're contemplating a move, seize this well-timed moment and reach out to our Estate Agency in Attleborough where your new home journey begins.