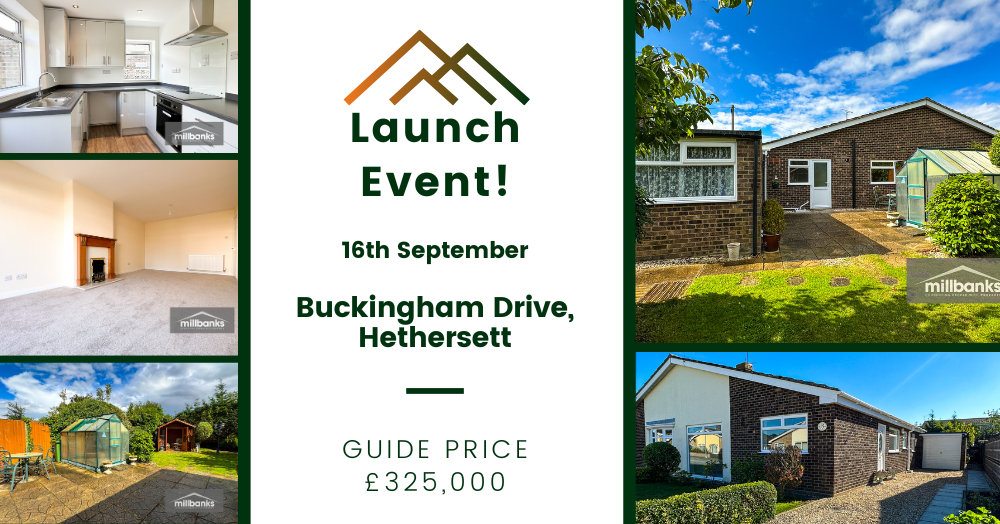
Launch Event at Buckingham Drive, 16th September!
Don't miss out on the chance to book a viewing for our launch event at Hethersett this Saturday!
We still have a few appointments left at this newly refurbished bungalow, so get in contact soon to book your slot!
This is an impressive well modernised semi-detached bungalow enjoying a cul-de-sac position with a south facing rear garden. The property has undergone a detailed refurbishment with a new kitchen, wet room and central heating boiler, whilst being redecorated throughout.
Contact us today to book a viewing. 01953 453838
To see the property in more detail click the link below.