Lockdown savings

Lockdown savings

In this short article we take a quick look at household savings during the pandemic

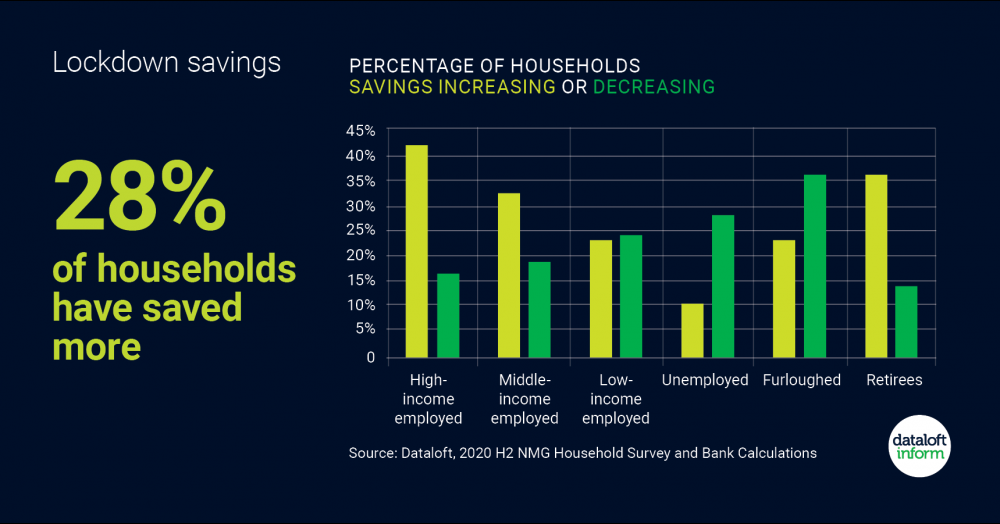
  • The pandemic reduced spending for many households and government policies have helped support incomes. This has led to 28% of households saving more during the pandemic.
  • 42% of high-income employed households saved more during the pandemic compared with 22% of low-income employed households. Retirees also saved more, 36% had increased their savings.
  • Which households have saved more and what those households plan to do with their savings will impact the housing market.
  • Households who have saved more could continue to support the higher levels of transactions and prices seen since May 2020. Source: Dataloft, 2020 H2 NMG Household Survey and Bank Calculations


Get in touch with us

May is a key month for sellers, but more homes are competing for attention. If you are thinking of moving this spring, here is how the current market is shaping buyer behaviour and what helps a home stand out.

This heat map reveals how rental yields vary across Attleborough, with darker areas delivering stronger monthly income and lighter zones producing lower returns. It also highlights a key investor insight: higher yields often sit opposite to long-term house price growth, showing why local strategy matters. Click to learn more...

Timing can make or break a house sale. New Attleborough property market data reveals why the first few weeks are critical, how overpricing can cost sellers valuable buyers, and why homes that sell quickly are far more likely to complete. The numbers tell a powerful story. Click the link to learn more...

Welcome to Attleborough’s property market update. This week’s snapshot reflects a slight shift driven by the mix of homes for sale rather than underlying values. It’s a useful gauge for homeowners and landlords, offering insight into market health and how your property fits within current local trends.