% of Homes That are Flats/Apartments on a Map
Not all parts of Attleborough are built the same — and that matters when buying, selling, letting, or investing. This map shows where flats are more common, revealing local housing trends. Different property types attract different buyers and tenants, so knowing your area helps you make smarter decisions.
Not all parts of Attleborough are built the same — and that matters deeply when you're buying, selling, investing, or letting.
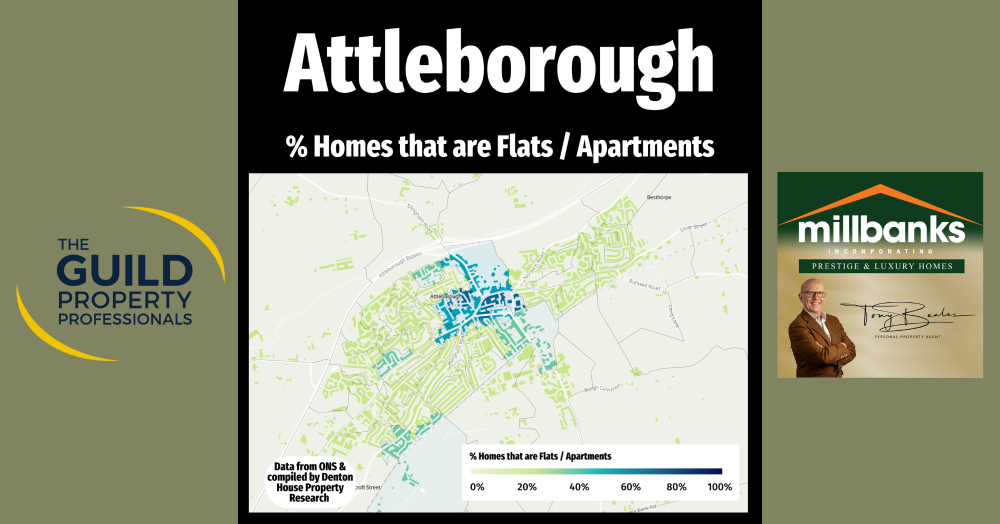
This map shows the proportion of homes that are flats or apartments across the local Attleborough area. Lighter areas have fewer flats, while the darker shades reveal hotspots where flats make up a significant share of the housing stock.
Why does this matter? Because different types of properties attract different types of buyers and tenants. A street dominated by apartments is likely to see more activity from first-time buyers, or renters. Meanwhile, areas with very few flats tend to attract families or long-term owner occupiers looking for more space.
If you're a Attleborough homeowner considering a sale, understanding the makeup of our local market helps you price and position your property correctly. And if you’re a landlord or investor, knowing where supply (and demand) for flats is highest can guide smarter decisions about where to buy next.
The Attleborough property market is not a one-size-fits-all market. It’s knowing the micro trends, like this, that helps you stay ahead of the curve.
Want to understand how this plays out on your street? Let’s talk.