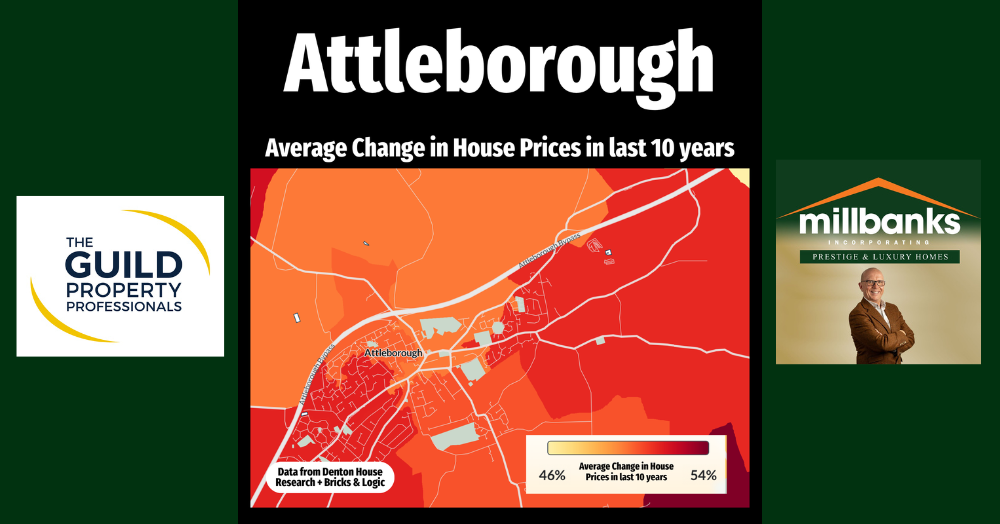
ORANGE HEAT MAP – House price Growth in Last 10 Years
Since 2014, UK house prices have climbed by 65.4%, but this national figure masks the varied growth across regions. In places like Attleborough, property values reflect distinct local factors, leading to differences in growth rates from city to city and town to town.
UK house prices have risen by 65.4% since 2014, yet the reality is that growth in property prices in the UK and indeed Attleborough has differed from city to city, town to town.
Looking closer to home, Attleborough has also experienced a varied rise in house prices, much like the wider UK property market, again rising at differing rates in the different neighbourhoods, depending on the specific area. As shown in the map, darker redder areas represent those with higher average house price growth, while lighter yellow colours indicate more modest increases.
While some areas of Attleborough have seen significant house price increases, others have experienced more tempered growth. It’s important to remember these are only average figures, so even in areas showing slower growth, individual properties may still have seen substantial value rises, and the reverse can also be true.
If you’re considering selling your Attleborough home or just want to know how much your Attleborough home might be worth in the current market, I would be happy to offer you a free, no-obligation valuation. Please call me on 07970203228 or drop me an email to tony@millbanks.com
Each home is unique, and understanding its specific value can provide clarity whether you’re looking to sell or simply curious about the market. Get in touch today to find out more about how much your property might be worth in today’s market.
