Qualifications
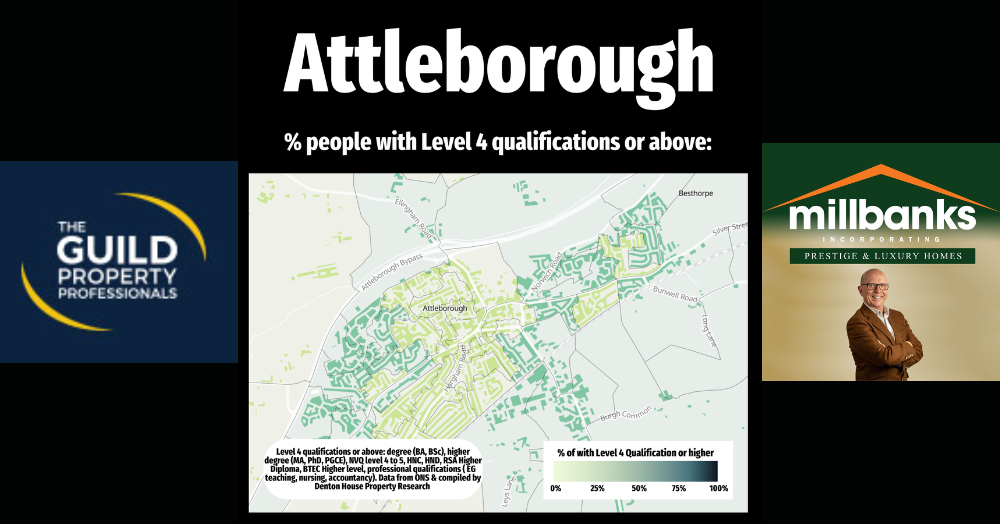
The Attleborough map shows residents with Level 4 qualifications or higher (degrees, advanced degrees, and professional credentials) based on recent Census and ONS data, providing insights into the town's educational diversity.
The map of Attleborough highlights the distribution of residents with Level 4 qualifications and above. Level 4 including degrees, higher degrees, and professional qualification. This is all based on data from the Office for National Statistics and the recent Census. This data offers a fascinating insight into the educational profile of our community and serves as a valuable resource for understanding Attleborough's diversity.
Educational qualifications can often reflect broader trends, including employment types, income levels, and the services valued by residents. For local businesses, organisations, and estate agents, this information is particularly relevant. It can provide clues about the type of housing, amenities, and services that might appeal to different areas of the community.
Importantly, this map is not about ranking areas or suggesting a hierarchy; it’s simply an exercise in understanding where people with different educational backgrounds live. The findings are a testament to the unique blend of skills, knowledge, and experiences that make up Attleborough's population.
Whether you're a resident, business owner, or someone new to the town, this data provides an opportunity to appreciate the diversity of our local community and consider how we can continue to cater to its needs and aspirations.