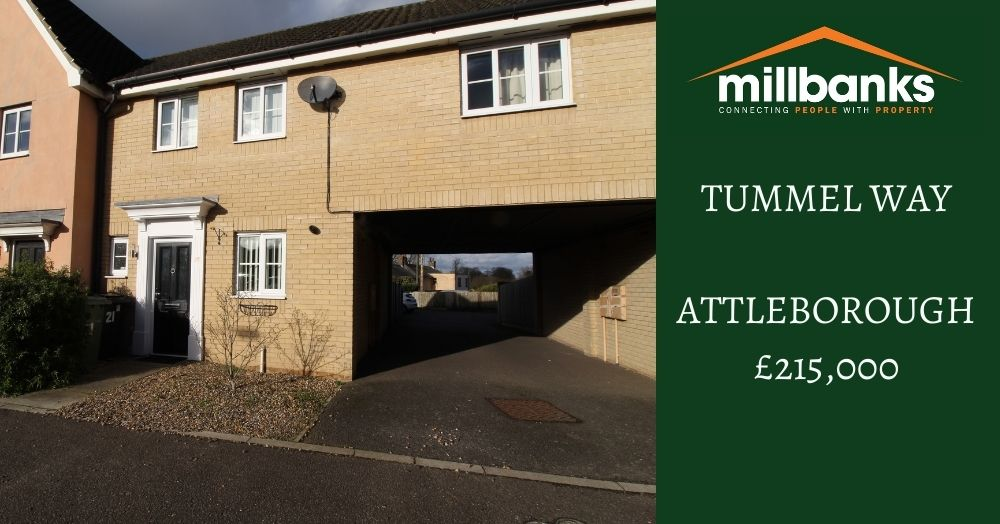
RECENTLY REDUCED - TUMMEL WAY
Interested to view? 📞📞📞01953 453838. We look forward to speaking with you soon!

Britain is a nation of suburbs, with nearly 60% of us choosing family estates and cul-de-sacs over city centres. In Attleborough, this demand for gardens, community, and connectivity powers our local market. If you want to know what buyers are really looking for or how your home fits in, click the article link to learn more..
As school holidays approach, family buyers often become more focused. For sellers with space, gardens or flexible rooms, July can be a useful moment to attract motivated movers.
Discover this exceptional 5-bedroom Grade II Listed detached character cottage in Norfolk, set on approximately one acre. Featuring a main house with 4 bedrooms, 2 reception rooms, and a stylish kitchen, plus a self-contained 1-bedroom cottage/annexe, extensive gardens, and a gated driveway.
Selling a home in today’s market requires experience, insight and a clear strategy. Between January and July 2026, Millbanks has successfully helped numerous homeowners and buyers across NR17, NR16 and NR9 achieve their objectives. In this article, we share our latest results, the approach behind them, and why our service continues to deliver.