Regional Property Market Update Spring 2021: Essex, Norfolk and Suffolk (East of England)
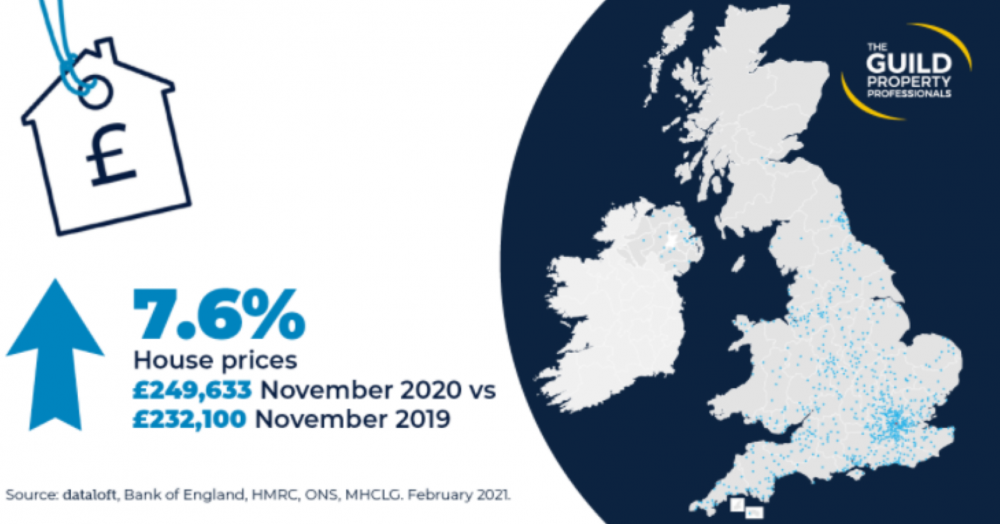
SPRING 2021 MARKET REPORT: PRICE GROWTH AT FOUR-YEAR HIGH
The Guild of Property Professionals Spring Property Report for Norfolk, Suffolk & Essex is now available, to view please click here