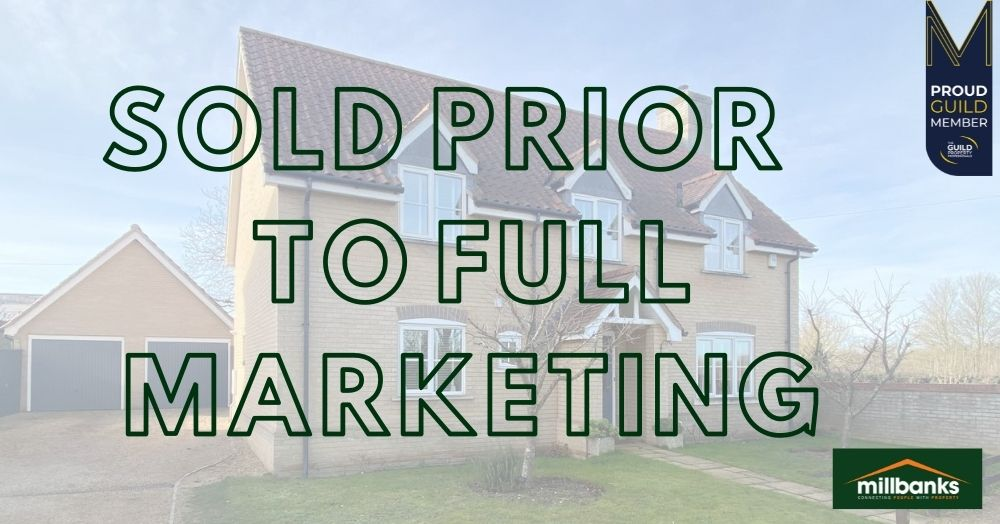
👏👏👏Sold Prior To Full Marketing👏👏👏


As 2025 draws to a close, this report examines how the UK and Attleborough property markets have performed and what may lie ahead in 2026. By comparing listings, sales, and prices with previous years, it reveals a market driven more by activity and confidence than by rising house prices.
This visual snapshot reveals how property values rarely move in unison. Some streets surge ahead, others advance more quietly, each following its own rhythm. It’s a reminder that markets are made of micro stories, where proximity alone doesn’t guarantee the same outcome.
This heat map uses census data to show where Attleborough residents work longer hours, revealing clear differences in working patterns across the town. By understanding how work-life balance varies between neighbourhoods, we gain useful insight into local lifestyles and the factors shaping our community.
Property Viewings begin at this Property's Launch Event on Saturday 3rd January 2026. A character-filled detached clay lump period bungalow offering a superb project for imaginative buyers. With generous rooms, distinctive features and plenty of potential, this is a great opportunity!