Stamp Duty Land Tax - The new temporary reduced rates explained
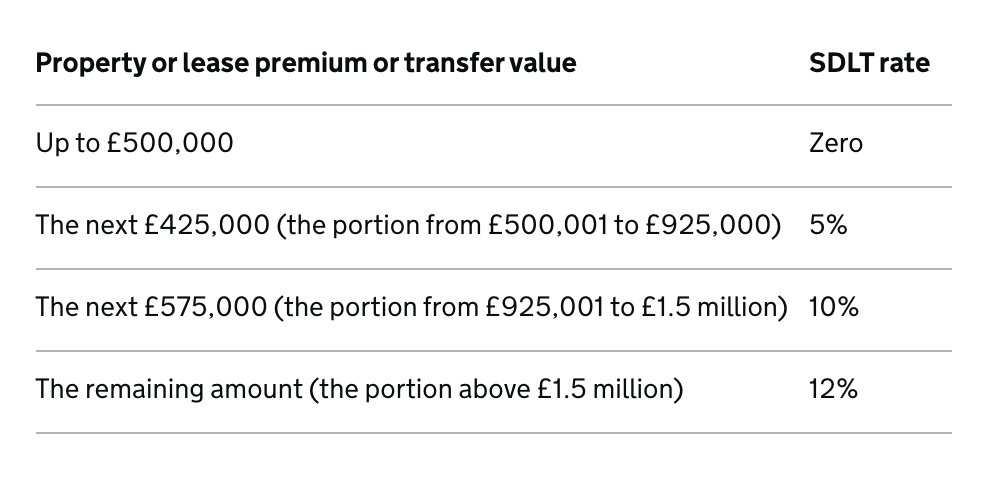
With immediate effect the new Stamp Duty Land Tax (SDLT) threshold of £500,000 will apply and will run until 31 March 2021. This means any buyer purchasing a primary residential property between 8 July 2020 and 31 March 2021, up to the value of £500,000, will be exempt of paying Stamp Duty.
Iain McKenzie, CEO of The Guild of Property Professionals, says according to a release by the Government the exemption will apply to all primary residential property purchases, so regardless of whether the purchaser is a first-time buyer or someone who has owned a property before.
He adds that on purchases over the £500,000 threshold, buyers will pay a 5% SDLT on the portion from £500,001 to £925,000, 10% on the portion from £925,001 to £1.5 million and 12% on any portion over £1.5 million.
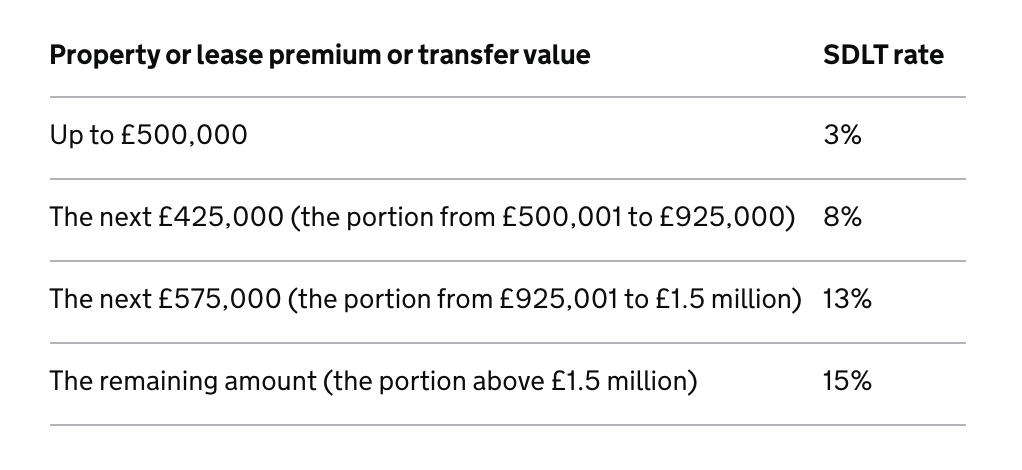
When it comes to purchasing a second home, McKenzie says that the Government has introduced higher additional rates with a 3% higher rate on top of the new revised standards. “So, what this means is that people purchasing a holiday home up to the threshold value of £500,000 will pay 3% SDLT. Those buying a second home over the threshold with pay 8% on the portion from £500,001 to £925,000, 13% on the portion from £925,001 to £1.5 million, and 15% on the remaining portion over £1.5 million,” McKenzie explains.
He notes that on new leasehold sales and transfers, the nil rate band which applies to the net present value of any rents payable for residential property is also increased to £500,000 until the end of March next year. A SDLT of 1% will be charged on any net present value of any rent over the threshold.
McKenzie says that it is not just individuals that will benefit from the changes. “Companies purchasing residential property under the £500,000 threshold will also be exempt from the paying SDLT. In additional companies that buy residential property of any value that meet the relief criteria from the corporate 15% SDLT will also benefit from the change made.”
From 1 April 2021, the SDLT holiday will come to an end and the SDLT regulations will revert to what they were before these temporary changes were announced. “We will likely see a rush of activity before 31 March 2021, with those who have access to finance making the most of the opportunity the SDLT holiday provides,” McKenzie concludes.
You can visit the Government website to calculate SDLT here.