The Alternative Measure of UK House Prices You Rarely See
Average house prices grab the headlines, yet they only tell part of the story. Looking at price per square foot reveals what buyers are truly paying for space. The 2025 figures show sharp regional contrasts, highlighting how the same budget can deliver vastly different lifestyles depending on where you buy.
We are all used to hearing about the average house price. It is the headline figure quoted in the press and the one most people reference in conversation. Yet average price only tells part of the story.
Another way to look at the market is through the price achieved per square foot. Rather than focusing on what a home sold for overall, it looks at how much buyers are willing to pay for the space itself. In a country where we still think in feet and inches, pounds per square foot offers a simple way to compare value between regions.
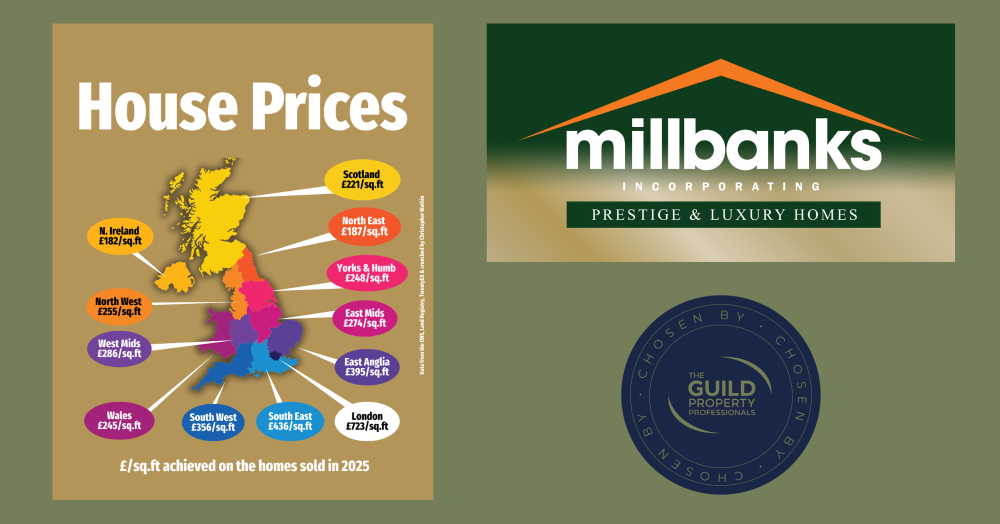
The 2025 figures show some clear contrasts. London sits in a league of its own, with the South East and East Anglia also commanding strong premiums. At the other end of the spectrum, Scotland, the North East and Northern Ireland offer considerably more space for the same money.
It is a reminder that a £500,000 budget buys very different lifestyles depending on where you are in the UK (a tiny 651sqft apartment in Inner London versus a 2,745sqft 5+ bed mansion in Northern Ireland)
Looking at price per square foot can also help explain why two homes with similar asking prices can feel very different in value. One may simply offer more usable space for the money.
For anyone who prefers metric measurements, the conversion is straightforward. Multiply the pounds per square foot figure by 10.76 to calculate pounds per square metre.
Average price gives the headline. Price per square foot gives the texture behind it.
If you are a Attleborough homeowner and would like to discuss where your Attleborough home sits in the market, then we would be more than happy to offer our opinion on a free no obligation market appraisal by calling us on 01953453838
If you'd like to find out what your home might be worth in 60 Seconds, please 'click' the banner ad below