The Housing Market Recovery Continues...

The Housing Market Recovery Continues...

In this short article we take a quick look at the housing market recovery, whilst also looking at the year on year comparisons

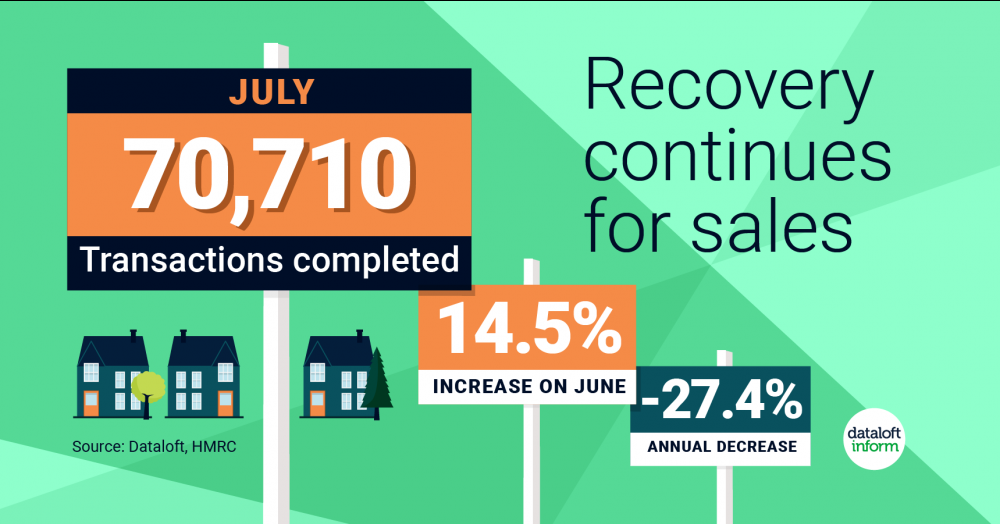
  • The housing market recovery continues. 70,710 transactions completed in July, 14.5% up on June. Numbers are still down on last year but the surge in new ‘sales agreed' will boost completions over the next few months.
  • 8,930 more sales completed in July than in June. Although transactions are increasing, they remain below the yearly average, -27.4% below July 2019 and -28.2% below July 2018.
  • In July, Rightmove reported the highest number of 'sales agreed' in any month since they started tracking the data, over 10 years ago. HMRC transaction figures will not show these sales until they complete.
  • We expect to see an increase in sales completed in August and September, reflecting increased demand from the stamp duty holiday. Source: Dataloft, HMRC


Get in touch with us

At first glance, UK house prices rising tens of thousands of per cent since 1900 look absurd. But annualised over 126 years, growth averages around 4.5 to 5 per cent a year. It is not sudden surges but steady compounding that drives values higher, showing property rewards time in the market more than attempts to time it.

Welcome back to the latest insight into Attleborough’s property market. This month’s £ per square foot snapshot offers a fresh look at the market’s underlying rhythm. It reflects the mix of homes currently for sale rather than headline price swings. Curious how your property fits the picture? Let’s arrange a relaxed, no obligation chat.

January 2026 showed a market regaining momentum. Across much of the UK, sales agreed are running ahead of two years ago, led by the Midlands and East. Scotland and Wales are also strengthening. London remains mixed, and Northern Ireland softer. This is not a boom, but a steady, broad based rebuild driven by realistic pricing.

Average house prices grab the headlines, yet they only tell part of the story. Looking at price per square foot reveals what buyers are truly paying for space. The 2025 figures show sharp regional contrasts, highlighting how the same budget can deliver vastly different lifestyles depending on where you buy.