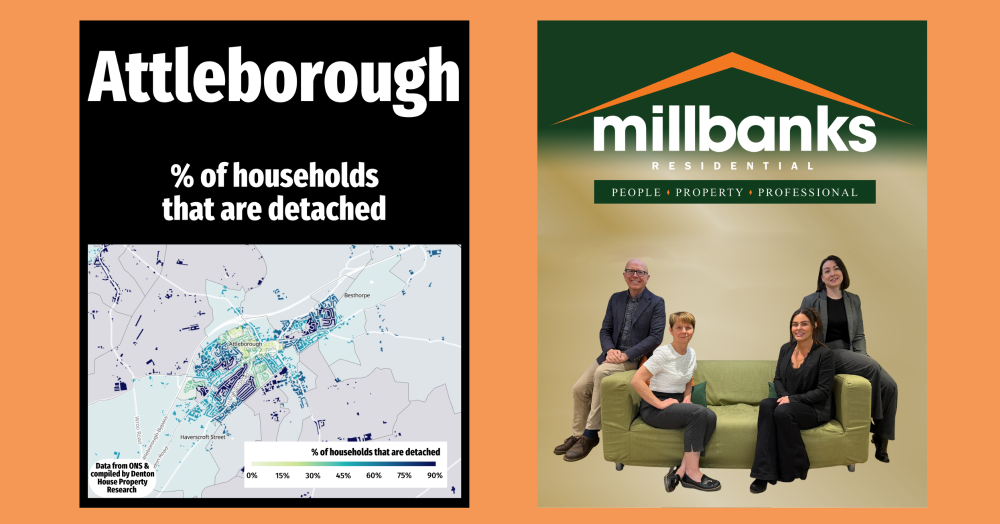
The percentage of homes that are detached in Attleborough
This map reveals how detached homes are spread across Attleborough, highlighting neighbourhood differences in housing types. Darker areas show higher proportions, while lighter zones reflect more terraces, semis and flats, with a clear pattern of detached homes on the outskirts shaped by historic growth and urban expansion. Click to learn more.
This map offers a fascinating snapshot of how housing is distributed across Attleborough, showing the percentage of homes that are detached in each neighbourhood.
The darker the shading, the higher the proportion of detached homes. The lighter greens point to areas with fewer, typically where you find more terraces, semis or flats. What stands out, and this is consistent in most towns and cities across the UK, is how detached homes tend to sit on the edges, not the centre.
That is not by accident. Town and city centres were built first, often when land was scarce and demand was high, so homes were packed in tighter. As towns expanded outwards over the decades, plots became larger, roads wider, and detached homes became more common.
Of course, there are always exceptions. Some central pockets will still have larger, older detached homes, often in sought after locations. Yet broadly speaking, this pattern holds true.
Understanding this helps explain not just where different types of homes are, but also why values vary street by street.
If you are curious how your specific part of Attleborough compares, or what this means for the value of your home, feel free to drop a message or click this link for a 60 sec Instant Valuation
If you're looking for a property? Why not register your 'Property Search' details by clicking this 'Head Up Property Alerts' link.