The Percentage of households with 4 or more people in Attleborough
What does Attleborough really look like beyond house prices? This map highlights where larger households are most common, revealing where families and shared living arrangements are concentrated. The pattern shows how different neighbourhoods function as distinct micro markets, each shaped by the people who live there. Click to learn more...
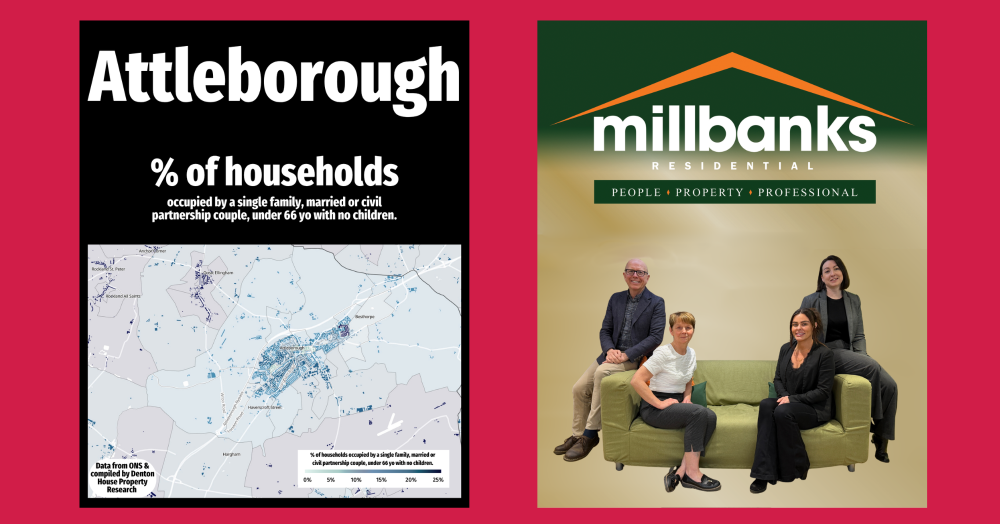
What does Attleborough really look like when you go beyond house prices and start looking at how people actually live?
This map tells a different story. It shows the proportion of homes in Attleborough with four or more people living under one roof. In simple terms, where the families are. Although it is worth noting that not every larger household is a family. Some will be shared homes, student lets, or HMOs. Even so, the pattern is revealing.
The darker areas highlight where larger households are more common, while the lighter tones point to parts of our area where smaller households dominate. This matters more than you might think. Areas with higher concentrations of larger households often behave differently in the property market. They tend to see stronger demand for family homes, different moving patterns, and often a more needs driven buyer.
It is a reminder that Attleborough is not one single market. It is a collection of micro markets, each shaped by the people who live there.
For homeowners, this insight gives context. When you come to sell, you are not selling into a national market or even a town wide one. You are stepping into a very specific local dynamic. Understanding that can make all the difference.
If you are curious as to the value of your home, feel free to drop a message or click this link for a 60 sec Instant Valuation
If you're looking for a property? Why not register your 'Property Search' details by clicking this 'Head Up Property Alerts' link.