UK House Sales June 25 vs June 24 by Region - UK Home Sales Jump by 8.7% in June!
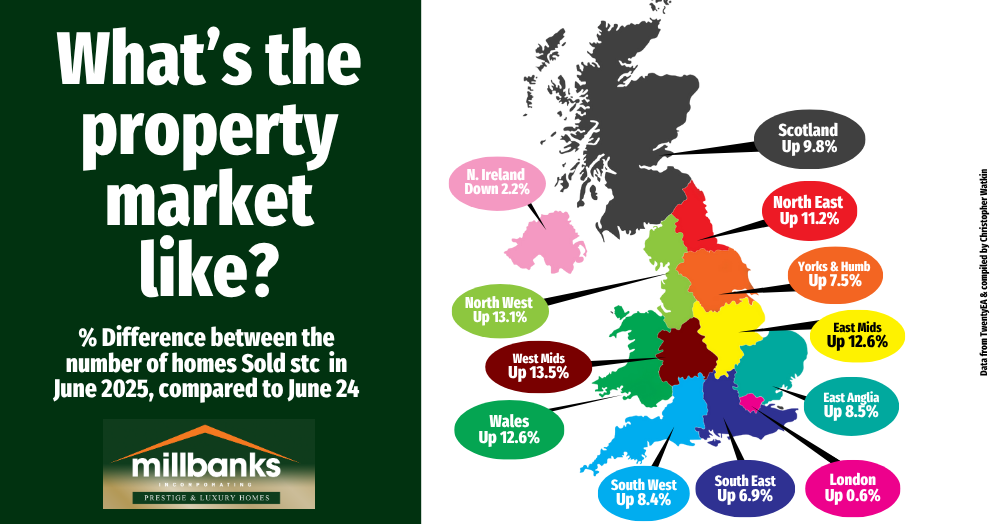
The property market is stirring again. In June 2025, 115,709 UK homes were marked as sold STC—up 8.7% from last year. But growth isn’t uniform—some areas are thriving, others slower. This isn’t just a spring bounce; it’s growing confidence, helped by realistic pricing, falling inflation, and stabilising mortgage rates.
There’s movement in the property market again.
In June 2025, 115,709 homes across the UK were marked as sold subject to contract that’s up from 106,403 sales in June 2024. A rise of 8.7% year on year.
But look closer at the graphic and you’ll see that this growth hasn’t been evenly spread. Some regions are absolutely flying and some are sluggish:
Overall, this is not just a spring bounce. It’s a sign that confidence is creeping back.
Some of this is being driven by more realistic pricing. Some by falling inflation and stabilising mortgage rates. And some by sheer pent-up demand finally converting into action.
So, what should Attlebrough & Breckland homeowners take from this?
That homes are selling if priced and marketed correctly. And if yours isn’t, it may be time to take a hard look at your asking price, your marketing or even your agent.
Because these numbers are not theory, they’re actual sales being agreed by agents on the ground..
This property market rewards momentum.
Don’t get left behind.
If you're thinking about upsizing, downsizing, or just want to get a handle on your Attlebrough & Breckland home's value, no matter how bedrooms it has, feel free to drop me a message or give me call 07970203228 or 01953453838 or by email tony@millbanks.com. No pushy sales pitch, just a helpful constructive conversation.