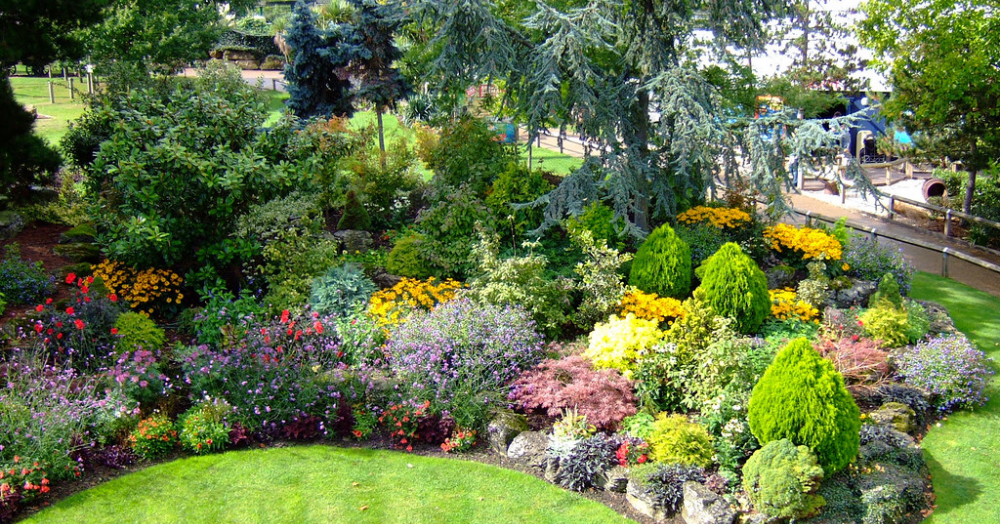
Get in touch with us
This data shows a clear north–south split in UK housing supply. Homes for sale are rising across London and the South, while much of the North is seeing stock fall. The contrast raises questions about affordability, confidence, and whether higher supply in the South could limit house price growth into 2026.
This map highlights how uneven UK house price growth has been over the last decade. While some regions have surged ahead, others have seen far more modest gains. It’s a clear reminder that national averages hide wide regional differences, and that property performance is always shaped by local markets rather than headlines.
Nearly one in four agreed house sales in Attleborough failed to complete in 2025, a figure that catches many homeowners by surprise. This article explains why so many moves fall through, what it really costs local sellers, and the practical steps Attleborough homeowners can take to reduce risk and improve their chances of a successful move.
If you own or rent property in Attleborough, tracking price trends matters. One useful indicator is the average price paid over the last 12 months, updated monthly. On its own it’s just a number, but over time it reveals direction, momentum, and what the local market may mean for your next property decision.