Attleborough: Homes Owned with a Mortgage – A Localised Snapshot
This snapshot explores the landscape of mortgaged homes in Attleborough today, including an overview of properties in the UK that are owned outright, with a mortgage or privately and socially rented.
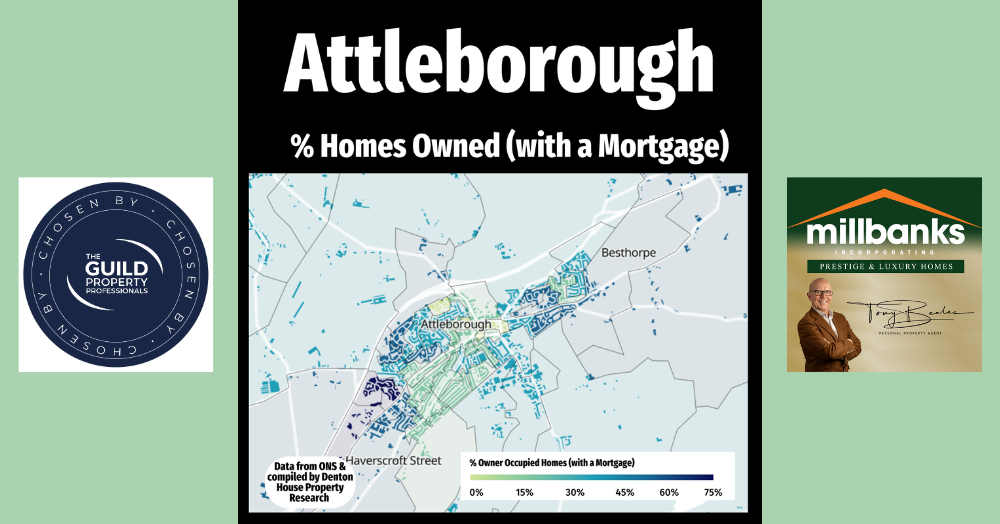
This visual map of Attleborough highlights the varying proportions of homes in different parts of the town that are owned with a mortgage or loan. The darker the shade, the higher the percentage of homeowners in that area still repaying a mortgage. Conversely, the greener areas indicate a lower proportion of homes without a mortgage.
It’s important to note that just because an area is green, it doesn’t necessarily mean most residents own their homes outright. These areas may have a higher number of social rented properties (typically owned by housing associations or the local authority), or a significant presence of private rental accommodation. Some of these homes may indeed be owned outright, particularly by older residents who’ve paid off their mortgage.
Nationally, around 64% of dwellings in the UK are owner-occupied. This breaks down as:
- 36% owned outright
- 28% owned with a mortgage or loan
- 19% privately rented
- 17% socially rented
As an estate agent working and living here in Attleborough, I live and breathe the local property market. If you ever want to chat about anything to do with property in our Attleborough—whether you’re buying, selling, or just curious—feel free to give me a call on (01953) 453838 or drop me an email to tony@millbanks.com