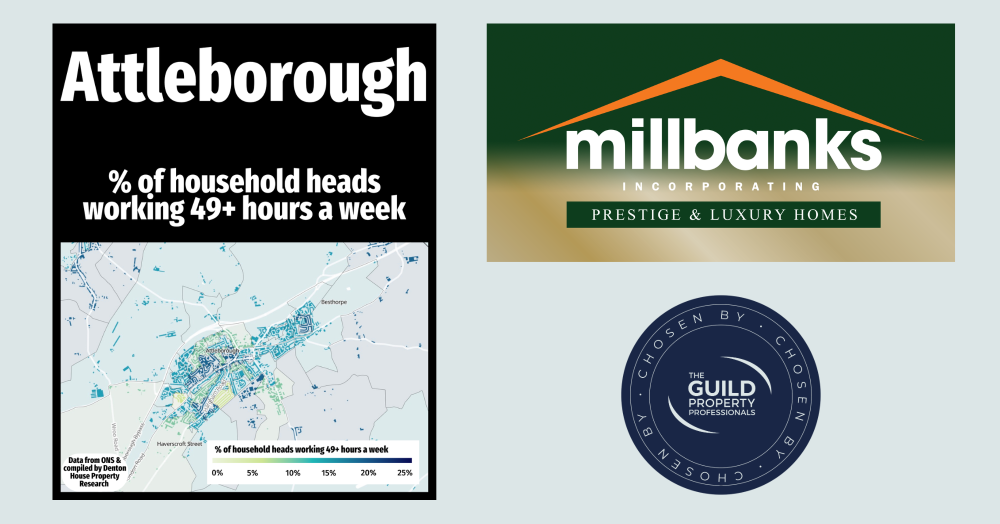
The percentage of people who work 49 hours or more per week
This heat map uses census data to show where Attleborough residents work longer hours, revealing clear differences in working patterns across the town. By understanding how work-life balance varies between neighbourhoods, we gain useful insight into local lifestyles and the factors shaping our community.
As property selling agent in Attleborough, we are dedicated to understanding the unique aspects of our local community to better serve our clients. Using data from the Office for National Statistics and the recent Census, this heat map illustrates the percentage of working residents in different areas of Attleborough who work more than 49 hours per week.
This map reveals diverse working patterns across our town, highlighting how working hours can vary significantly between neighbourhoods. Some areas have higher percentages of residents working long hours, while others have fewer. This information can provide valuable insights into the lifestyle and work-life balance of our local population.
I am keen to explore what drives these differences in working hours. Are certain industries or job roles more prevalent in specific areas? How does this impact our community in Attleborough?
I hope this map sparks a thoughtful discussion and a deeper understanding of our towns working habits.
Why not add your thoughts and observations on this topic, they are most welcome!