Average House Prices in the Regions
As an estate agent in Attleborough, I'm pleased to present an informative infographic detailing average house prices across UK regions. This valuable market insight helps both buyers and sellers stay well-informed about current trends shaping their decisions.
As an estate agent in Attleborough, I'm pleased to present a detailed infographic illustrating the average house prices across the various UK regions. This valuable insight into the property market ensures that both buyers and sellers are well-informed about the current trends affecting their decisions.
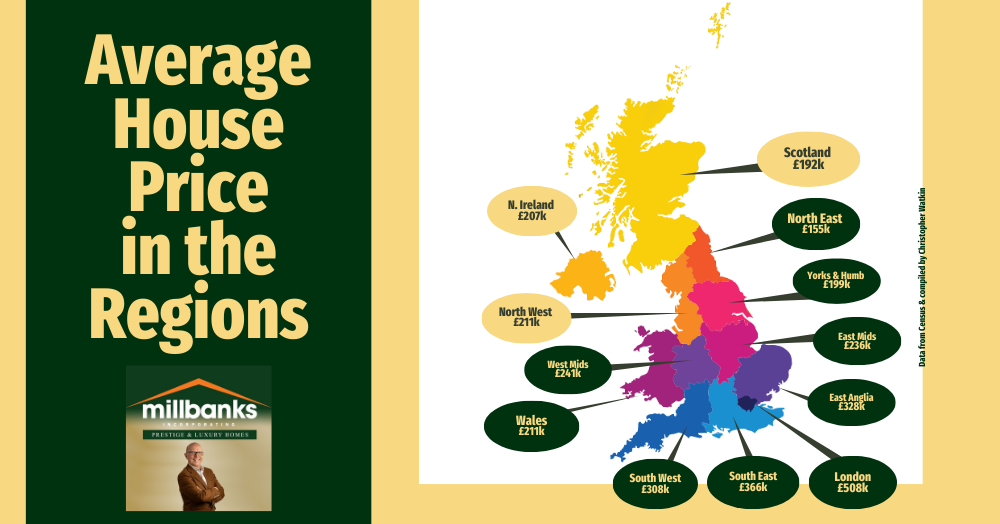
Here's a summary of the average house prices by region, sorted from highest to lowest:
- London: £508k
- South East: £366k
- East Anglia: £328k
- South West: £308k
- West Midlands: £241k
- East Midlands: £236k
- North West: £211k
- Wales: £211k
- Northern Ireland: £207k
- Yorkshire and The Humber: £199k
- Scotland: £192k
- North East: £155k
These figures reflect the dynamic and varied nature of the UK property market, highlighting significant regional differences that can influence buying and selling strategies.
For prospective clients in Attleborough or anywhere in the UK, understanding these trends is crucial for making informed decisions, whether you're considering buying a first home, investing in property, or planning to sell.
At our agency, I pride myself on providing accurate, up-to-date market data to help you navigate the complexities of the property market. Whether you're looking to get a general sense of property values in your area or need detailed advice tailored to your specific circumstances, our team is here to offer expert guidance based on the latest market analysis.
If you have any questions about the Attleborough property market or further afield, feel free to pick up the phone on 07970203228 or (01953) 453838 and ask for Tony Beales or drop me an email to tony@millbanks.com.