EPC Ratings By Region
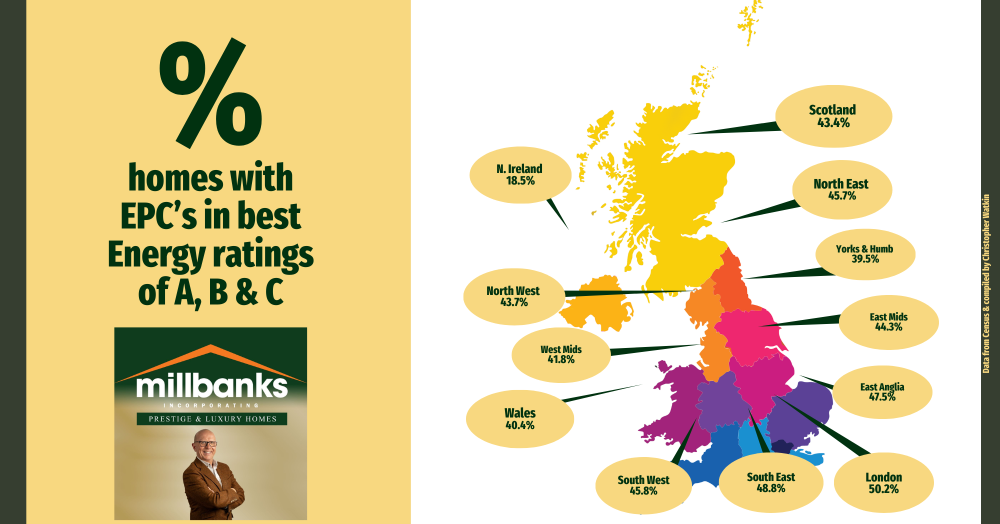
A quick overview of the percentage of homes in twelve UK regions that have attained top Energy Performance Certificate (EPC) ratings of A, B, or C.
This infographic provides a snapshot of the percentage of homes across twelve UK regions that have achieved the best Energy Performance Certificate (EPC) ratings of A, B, or C.
EPC ratings measure a property’s energy efficiency, with A being the most efficient. The data reveals a substantial variation in energy-efficient homes across the UK.
Ranked in order, the regions with the highest proportion of top-rated homes are as follows:
1. London: 50.2%
2. South East: 48.8%
3. East Anglia: 47.5%
4. South West: 45.8%
5. North East: 45.7%
6. East Midlands: 44.3%
7. North West: 43.7%
8. Scotland: 43.4%
9. West Midlands: 41.8%
10. Wales: 40.4%
11. Yorkshire & the Humber: 39.5%
12. Northern Ireland: 18.5%
With early data hinting that homes with higher EPC ratings may fetch slightly higher prices, these figures could become increasingly relevant for homebuyers and sellers.
While it is still early days, these initial statistics suggest a possible premium for energy-efficient homes, which may encourage both buyers and sellers to consider EPC ratings more closely.
However, this trend is in its infancy, and further data is needed to confirm a strong link between EPC ratings and property values. If you have any questions about the Attleborough property market, feel free to pick up the phone and call me on 07970203228 and ask for myself Tony Beales.