Exploring Attleborough’ 3 Person Households: A Demographic Insight
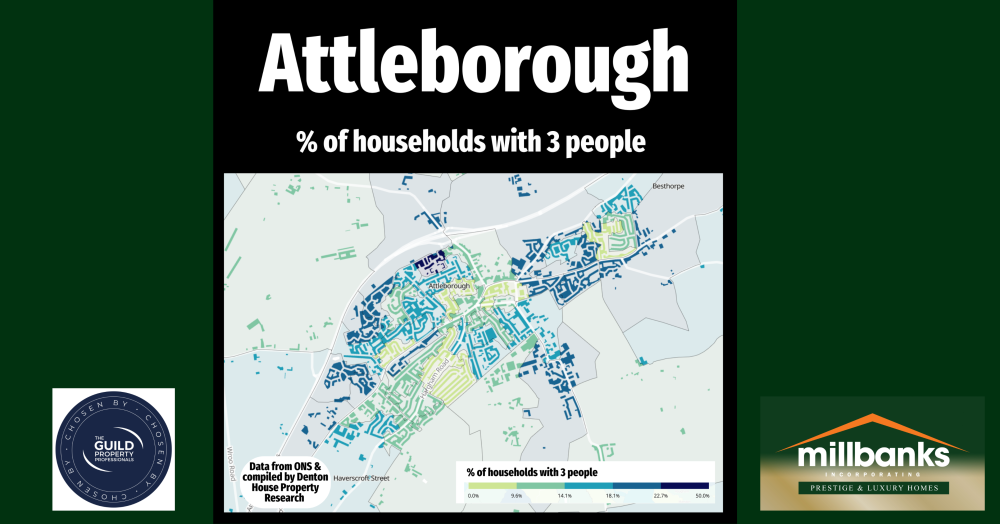
This month's ONS Heat map provides an intriguing look at the distribution of three-person households across Attleborough
This month's ONS Heat map provides an intriguing look at the distribution of three-person households across Attleborough. The darker shades of blue on the map indicate areas with a higher percentage of three-person households, while the lighter shades towards green show areas with a lower percentage. This visualisation offers a snapshot of where three-person households are more concentrated in Attleborough. reflecting the demographic patterns in different parts of the town.
As an estate agent, I aim to spark discussion and provide valuable insights into the property market, which I know captivates many. Every month, I publish a different graph, focusing on various property metrics. This not only keeps us informed about trends but also encourages thoughtful conversation about the dynamics of Attleborough’s property landscape. Understanding such patterns can be particularly useful for both buyers and sellers, helping to make more informed decisions.
If you would like to discuss any matter regarding the Attleborough property market, feel free to email me on tony@millbanks.com or telephone me on (01953) 453838 or 07970 203228.