House Price Rises in the Last 50 Years
The graphic illustrates the staggering percentage increases in house prices across various regions of the UK over the last 50 years. The data, sourced from Land Registry, Denton House Research and Nationwide, sheds light on how each part of the UK has seen unprecedented growth.
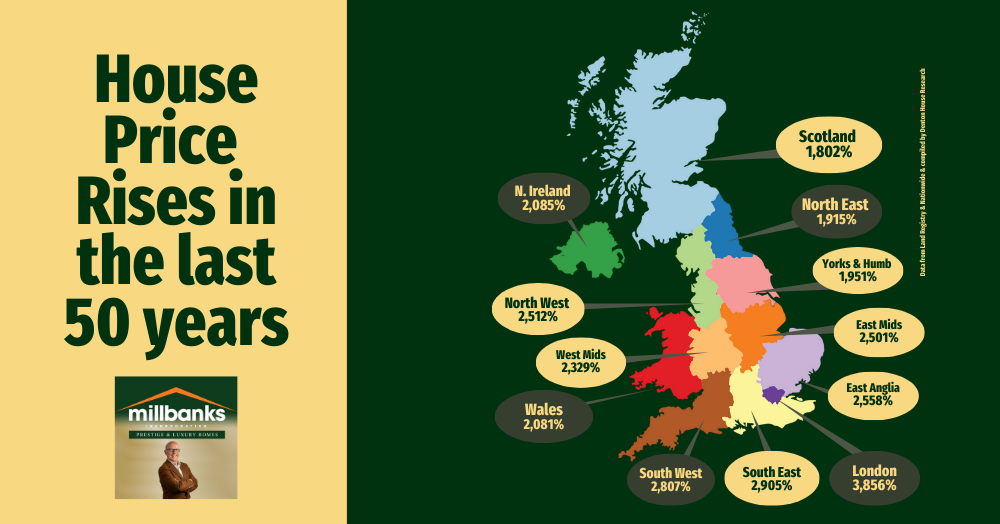
The graphic illustrates the staggering percentage increases in house prices across various regions of the UK over the last 50 years. The data, sourced from Land Registry, Denton House Research and Nationwide, sheds light on how each part of the UK has seen unprecedented growth. Here’s a breakdown, listed in order of the size of growth:
- London: 3,856%
- South East: 2,905%
- South West: 2,807%
- East Anglia: 2,558%
- North West: 2,512%
- East Midlands: 2,501%
- West Midlands: 2,329%
- Wales: 2,081%
- Northern Ireland: 2,085%
- Yorkshire & Humberside: 1,951%
- North East: 1,915%
- Scotland: 1,802%
This extraordinary surge in UK house prices raises a few important points of comparison. Inflation over the last 50 years in the UK has been 891%. Over the same period, the average price of a new car has risen by around 1,400%. Household goods like televisions, while improving in functionality and quality, have seen price increases of only 50% to 100%, yet a pint of beer has increased by 2,100%. In context, average UK wages have risen by 1,867%.
The housing market's growth dwarfs these figures, making property one of the most significant long-term investments over the last five decades.
While inflation, wage growth, and population density have played roles in these price rises, the stark differences between regions—especially London compared to other parts of the UK—show that ‘location location location’ still reigns supreme in property investment decisions. Of course, those regions that have not performed so well in the long term, have seen some of the best growth over the last five to ten years, so who knows if they are starting to catch up with the other regions? Only time will tell!
This historic growth suggests that for those who own homes, particularly in certain areas, their properties have not only provided shelter but have become one of the best investments they could have made.
What do you think about these changes people of Attleborough? Have you or your family experienced the impact of these property price rises? I'd love to hear your opinions. Please share your thoughts!