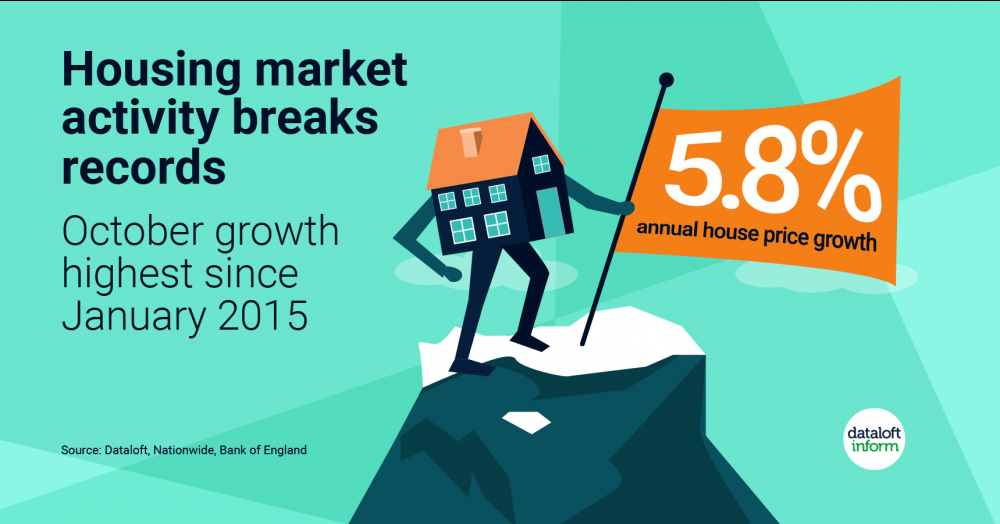
Housing market activity breaks records
In this short article we take a look at the growth in the Autumn housing market
- Nationwide October House Price index reported an astonishing 5.8% annual house price growth, the highest rise since January 2015. Mortgage approvals were at their highest since September 2007, with 91,454 in the month.
- Data suggests the recovery of the economy has slowed with only 2.1% monthly growth reported in August and the unemployment rate rising to 4.5% in the three months to August (ONS).
- Despite this, housing market activity has remained robust. Transactions have recovered to pre-Covid levels, mortgage approvals increased by 6.9% annually and the average house price now stands at £227,826.
- We are now entering a second lockdown, however, the housing market will remain open, the furlough scheme has been extended and mortgage holidays are available. Housing market demand is likely to be maintained over the next few months, with many buyers wanting to make the most of the stamp duty concessions, as well as beating the impending changes to overseas surcharge and the Help to Buy scheme. Source: Dataloft, Nationwide, Bank of England