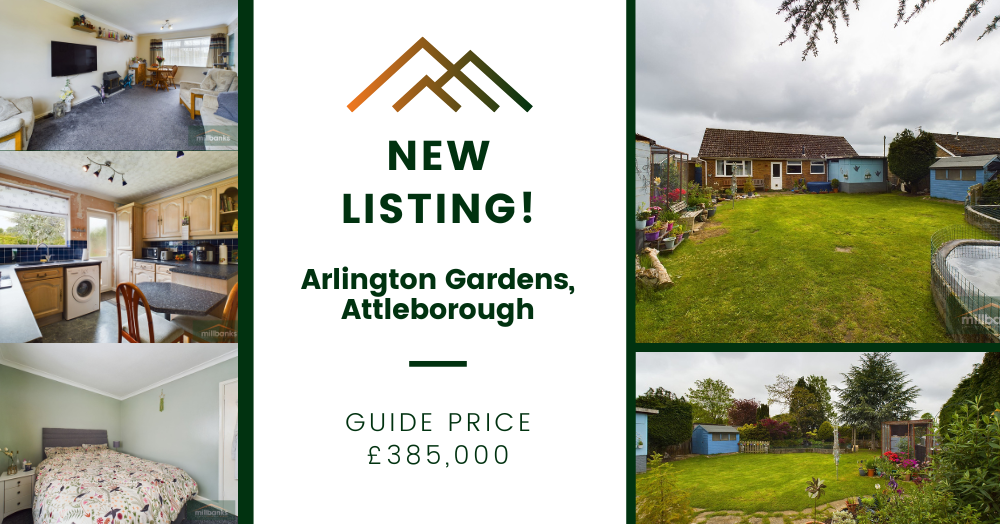
New Listing!
Are you looking for a 3 Bedroom property within walking distance to Attleborough town centre? If so we may have the perfect one for you...
New to the market this week, Arlington Gardens is a 3 bedroom detached bungalow on a generous sized plot with a good-sized rear garden and a large pond, perfect for outdoor activities. The property features a 19ft lounge/diner, a kitchen/breakfast room, and a bathroom and is conveniently located within walking distance to the town centre.
For more details on this property click the link below:
To get your viewing booked in, call the office on 01953 453838 or email us at propertysearch@millbanks.com