Stamp Duty receipts at highest level since 2017

Stamp Duty receipts at highest level since 2017

In this speed read we take a look at Stamp Duty receipts

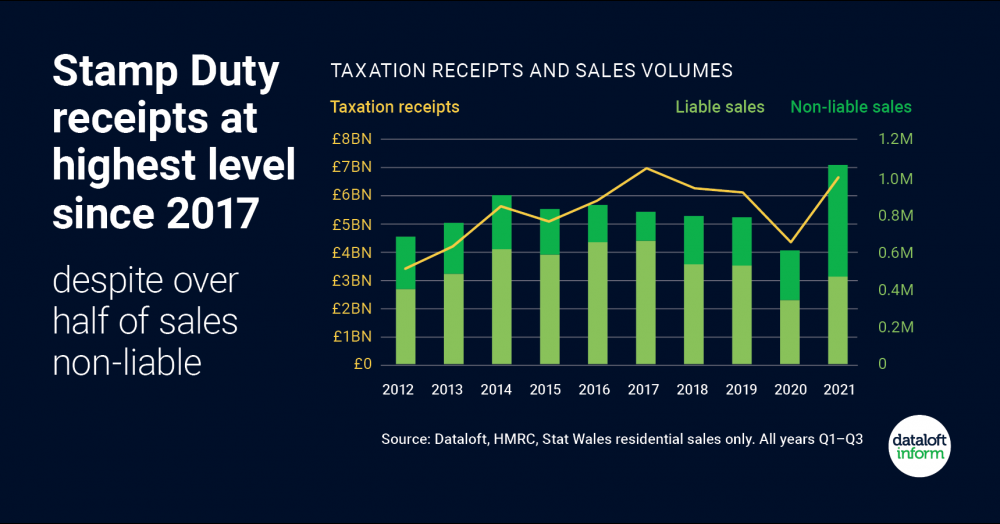
  • Over £6.6 billion has been collected in residential tax receipts (SDLT and LTT) across England and Wales in the first 9 months of 2021, the highest total since 2017.
  • This is despite the fact 600,000 sales (56%), did not pay any tax due to the stamp duty holidays, first-time buyer tax relief, or were sold below the taxation threshold.
  • In England, over 25,600 sales have been for £1 million or more, nearly double the 2017-2019 average, no doubt a significant factor.
  • 5,500 property sales have been subject to the 2% additional surcharge for overseas purchasers since its introduction in England on April 1st, netting the treasury an additional £44 million in tax.
  • Source: Dataloft, HMRC, Stat Wales residential sales


Get in touch with us

This map reveals how detached homes are spread across Attleborough, highlighting neighbourhood differences in housing types. Darker areas show higher proportions, while lighter zones reflect more terraces, semis and flats, with a clear pattern of detached homes on the outskirts shaped by historic growth and urban expansion. Click to learn more.

Flats have long been a popular first step onto the property ladder, but across the UK the market is changing. In many areas, flats are taking longer to sell and demand is shifting towards houses. Is Attleborough seeing the same trend, or is the local market telling a different story? Click to learn more...

This heat map reveals how rental yields vary across Attleborough, with darker areas delivering stronger monthly income and lighter zones producing lower returns. It also highlights a key investor insight: higher yields often sit opposite to long-term house price growth, showing why local strategy matters. Click to learn more...

Welcome to Attleborough’s property market update. This week’s snapshot reflects a slight shift driven by the mix of homes for sale rather than underlying values. It’s a useful gauge for homeowners and landlords, offering insight into market health and how your property fits within current local trends.