Take a Virtual 360 Tour - Estab. 2-Bed Former Serviceman's Mid-Terrace Home with Off Road Parking x2
A delightful two-bedroom home with an open front outlook over open greensward, lounge features a cosy open fireplace, a sleek kitchen/diner flowing into an outside garden room, modern bathroom, generous storage, low-maintenance garden and private parking. Warm, stylish and ready to enjoy.
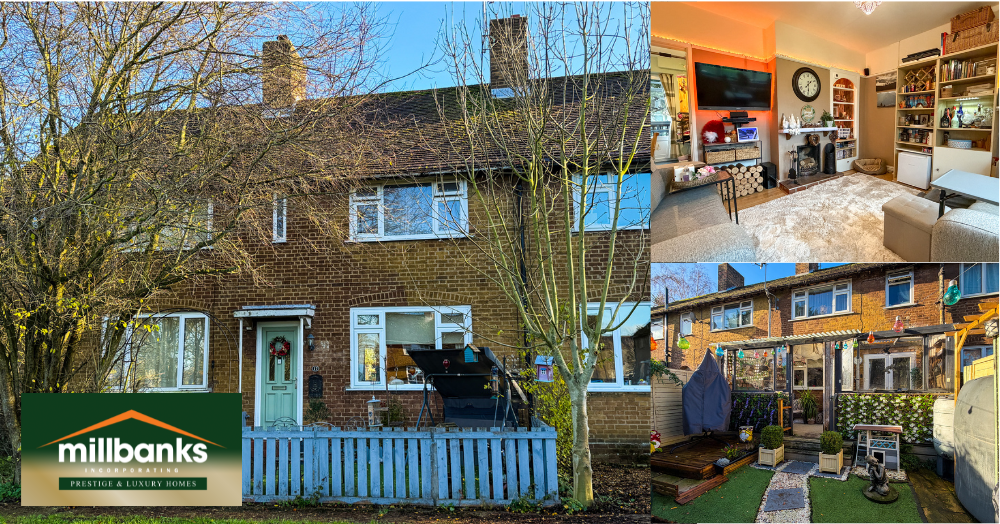
Introduction
Situated on the outskirts of Watton and enjoying an open front outlook across an open greensward, this established two-bedroom mid-terrace home offers a calm and inviting place to live. Warmed by character touches such as an open fireplace and complemented by thoughtfully arranged living spaces, it blends comfort with everyday practicality. With a low-maintenance rear garden and the added benefit of off-road parking, this is a home that feels quietly confident and ready to welcome its next chapter.
To take a full 360 degree Virtual Tour of this property, please click here
To see the full brochure and book your appointment to view please click here
If you'd like to find out what your home might be worth in 60 Seconds, please 'click' the banner ad below!