The UK Property Market Update for the week, finishing Sunday, the 13th April 2025.

The UK Property Market Update for the week, finishing Sunday, the 13th April 2025.

This week's update provides a statistical analysis, offering insights into what’s happening and shaping the UK Property Market, for week finishing Sunday, the 13th April 2025.

The UK Property Market Update for the week, finishing Sunday, the 13th April 2025.
 
✅ Listings (New Properties on the Market)
 
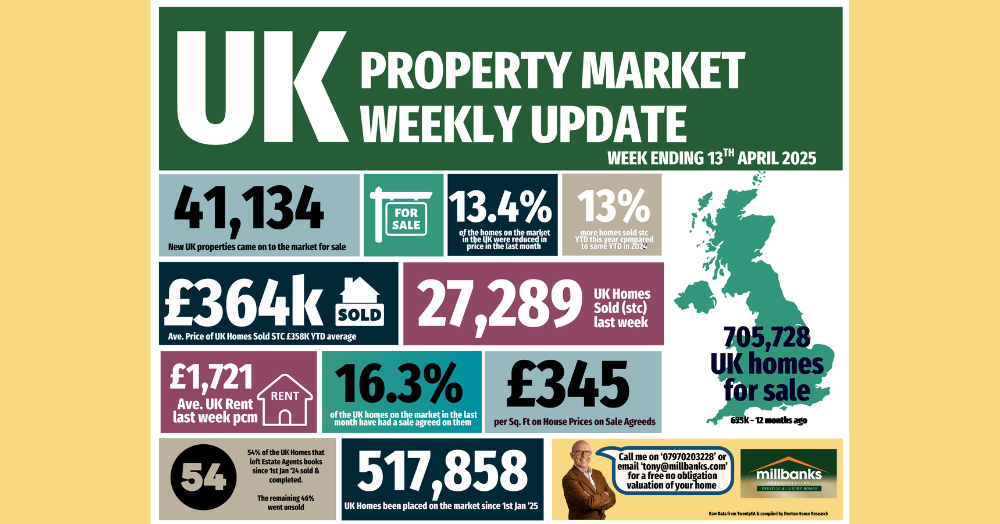
41.1k new listings this week (last week 41.3k)
That’s 9% higher than Week 14 of 2024 YTD and 9% higher YTD compared to 2017/18/19.
 
✅ Price Reductions (% of Resi Stock)
 
24.9k Price Reductions this week -  Run rate of 1 in 7.5 of Resi Sales stock per month is being reduced (which represents 13.4%).
 
For comparison, 12.1% average in 2024, though the long-term 5-year average is 10.6%.
 
✅ Total Gross Sales (Agreed Sales)
 
27.3k UK homes sold STC this week, down slightly from a fortnight ago, which was a near 3 year record breaking week of 28k Resi gross sales.
 
That’s 14% higher YTD compared to 2024 and 22% higher than 2017/18/19 YTD levels.
 
✅ Sell-Through Rate (Monthly in Arrears)
 
March’s sale run rate of 16.3% of Resi stock sold stc (ie 16.3% of Estate Agents properties on the market went sale agreed). 2024 monthly average: 15.3%. Long-term 8-year average: 17.9%.
 
✅ Sale Fall-Throughs
 
6,275 Sale fall-thrus last week from Resi Sale Sales Pipeline of 467,414 homes sale agreed (sold stc). 
 
Another method is that week’s sale fall thrus as a % of gross sales that week. This week, that is 23% (last week 23.7%). Just above the 7-year average of 24.2%, yet well below the 40%+ levels post-Truss Budget (Autumn 2022).
 
Last month, as a whole, 5.75% of sales in the UK agents pipelines fell thru. For comparison, 2024 average: 5.36%.
 
✅ Net Sales (Gross sales for the week less Sale Fall Thrus for the week)
 
21k net sales this week (21k last week), compared 2025 weekly average of 20.1k. 
 
2025 YTD is 11% higher than compared to 2024 YTD and 15.9% higher than YTD 2017/18/19.
Stats compiled by Property 'Stato' Chris Watkin using Twenty EA Data
Get in touch with me today to learn more about my tailored advice and marketing strategies to help sell your Attleborough home.
𝗖𝗮𝗹𝗹 𝗺𝗲 𝗼𝗻 (𝟬𝟭𝟵𝟱𝟯) 𝟰𝟱𝟯𝟴𝟯𝟴 𝗼𝗿 𝟬𝟳𝟵𝟳𝟬𝟮𝟬𝟯𝟮𝟮𝟴 𝗼𝗿 𝗱𝗿𝗼𝗽 𝗺𝗲 𝗮𝗻 𝗲𝗺𝗮𝗶𝗹 𝘁𝗼 𝘁𝗼𝗻𝘆@𝗺𝗶𝗹𝗹𝗯𝗮𝗻𝗸𝘀.𝗰𝗼𝗺


Get in touch with us

Over the past half century, the British housing market has transformed beyond recognition. 🏡 House prices have risen dramatically, far outpacing inflation and wages. For some, the gains have been life-changing — for others, the climb onto the property ladder feels steeper than ever. Share your 1970s Attleborough stories below! 💬

A weekly countdown series of the most popular Cottage names in the UK . The countdown is based on the total number of Cottages sold in the last 10 years & the average value of those Cottages Next week will be 95 to 91 ..and 5 each week there after

Step inside this beautifully redesigned 4-bedroom family home, offering contemporary living with premium finishes. Features include a spacious, light-filled lounge, open-plan kitchen/dining/snug with wood-burning stove, triple bi-folds to a south-facing garden, 24ft garden studio, luxury bathroom, double garage, ample driveway, and EV charging.

Thinking of selling your home or simply curious about what’s really happening in Attleborough’s property market? Behind every monthly figure lies a story about where values are heading and what it means for you as a homeowner or landlord. Understanding the trend could shape your next move—and help you stay ahead.