Tracking Housing Demand Post Lockdown

Tracking Housing Demand Post Lockdown

In this article we look at the huge surge of consumer interest in housing since 13th May

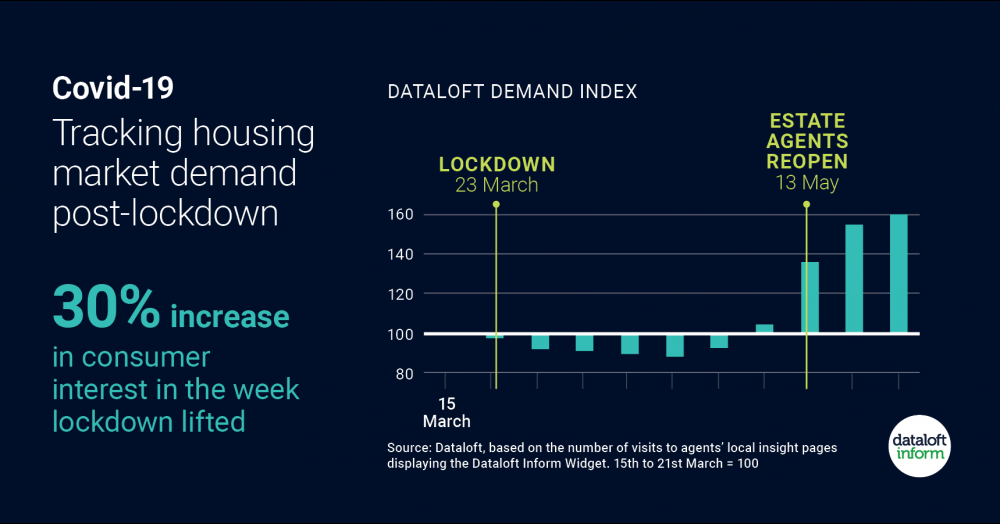
  • There has been a huge surge of consumer interest in the housing market since May 13th, according to the Dataloft Demand Index.
  • In the week that lockdown was lifted, the Index climbed by 30%. By the end of May, it was 71% higher than a month earlier.
  • The Dataloft Demand Index suggests a strong start to the post-lockdown market, with agents’ sites receiving plenty of attention from prospective home movers.
  • The Index tracks the number of visits to agent’s local insight pages displaying the Dataloft Inform widget, making it a valuable indicator of potential demand.


Get in touch with us

What does Attleborough really look like beyond house prices? This map highlights where larger households are most common, revealing where families and shared living arrangements are concentrated. The pattern shows how different neighbourhoods function as distinct micro markets, each shaped by the people who live there. Click to learn more...

Rental growth has eased, but tenants are still searching carefully and landlords need to stay on top of pricing, compliance and property standards as the summer moving season continues.

Across almost every UK region, houses are more likely to sell than flats. In some areas the gap is small, in others it is dramatic. Scotland is the only exception, where flats outperform houses. So what is driving this divide, and what does it mean for homeowners in Attleborough? Click to learn more...

Against a noisy global backdrop, the UK housing market has quietly surged, posting its strongest week for sales agreed in 45 weeks. Demand hasn’t vanished, it has sharpened. Well-priced homes are moving fast, while overpriced listings linger, making strategy and timing more critical than ever.