UK Property Market 2025 vs 2024, A More Local Story Than Ever
UK home sales agreed in 2025 tell a story of steady progress rather than drama. Many regions are seeing uplift thanks to realistic pricing and strong demand, while others are adjusting to affordability and expectations. The market is functioning, confident, and increasingly shaped by local conditions.
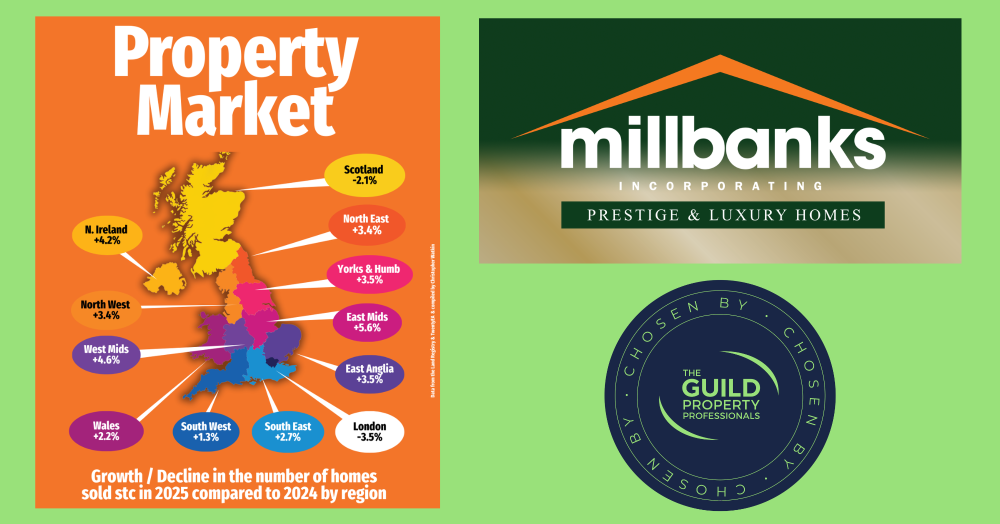
This comparison of UK homes, spilt down by regoinsold subject to contract in 2025 versus 2024 shows a market that is steady overall, but increasingly shaped by local conditions rather than national headlines.
Several regions have seen encouraging growth in house sale volumes. The East Midlands leads with transactions up 5.6%, closely followed by the West Midlands at 4.6%. These areas continue to benefit from a combination of affordability, sensible pricing and consistent buyer demand.
Across the North, activity remains positive and resilient. The North West and North East are both up 3.4%, with Yorkshire and the Humber slightly higher at 3.5%. Northern Ireland also continues its steady recovery, recording a 4.2% uplift in sales agreed.
In the South, growth is present but more measured. The South East has seen a 2.7% increase, while the South West is up 1.3%. These figures reflect a market that is functioning, but with buyers taking more time and being more selective.
For Scotland and London, sales volumes are lower than last year, down 2.1% and 3.5% respectively. Rather than signalling weakness, this points to adjustment. Both markets are highly sensitive to pricing, affordability and policy changes, and typically respond later in the cycle. Importantly, demand remains, but expectations on price and value are tighter.
The key conclusion is one of clarity rather than concern. Where pricing aligns with buyer realities, homes are selling. The UK market in 2025 is not slowing, it is recalibrating, region by region, with confidence following realism