UK Property Market Weekly Update for the ending Sunday, 1st December 2024, (week 48)
This update provides an overview of the latest trends, data, and insights shaping the UK property market. Stay informed about key developments, price movements, and market dynamics to better understand the current landscape and what it means for buyers, sellers, and investors.
UK Property Market Weekly Update for the ending Sunday, 1st December 2024, (week 48)
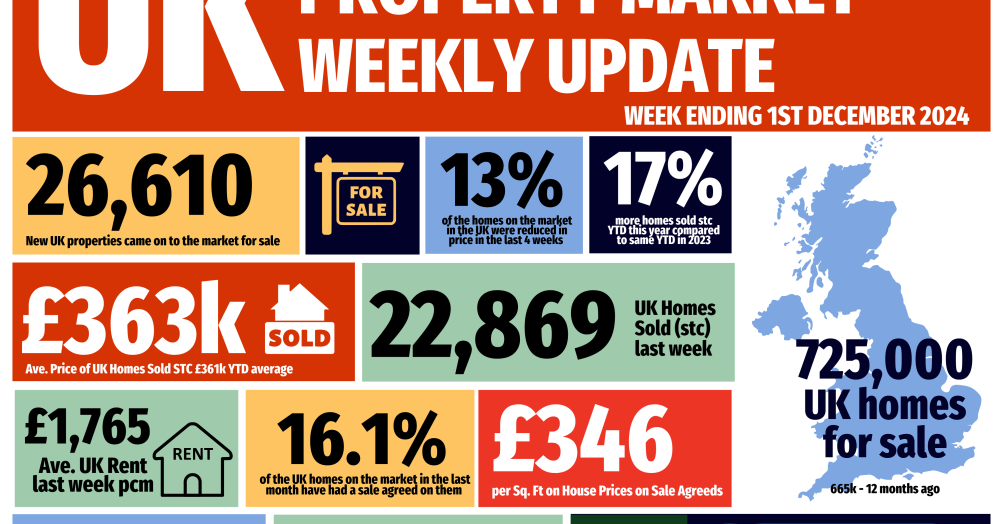
Listings (New properties coming on to the market) - 24.6 UK listings this week (week 48), an expected drop of 2.6k from last week. 8.4% higher 2024 YTD than 2023 YTD.
· % of Resi Sales Stock being reduced (Monthly): 13% of Resi sales stock was reduced in the last month. 14% last month and long term 5 year average 10.6%.
· Total Gross Sales - 22.8k UK homes sold stc this week (Week 48), 4% lower than last week. 20% higher than the same standalone week (week 48) in 2023. Also, 8.8% higher than 2017/18/19 YTD levels & 15.2% higher than 2023 YTD levels.
· Sale Thru rate (Monthly): UK Estate Agents sold 16.11% of their Resi sales stock last month. 2024 average is 15.86% & the 7 year long term average is 17.9% per month - yet don’t forget that was only in mid/late 20%’s in the crazy years of 20/21/22).
· Sale fall-throughs - For the week 48, Sale Fall Thrus (as a % of Gross sales Agreed) decreased 23.8%). The 7 year Long Term weekly Average is 24.8% and it was 40%+ in the two months following the Truss Budget in the Autumn of 2022.
· Net Sales - 17.4k this week (average for last 4 weeks 17.6k). 20% higher than the same week 48 in 2023, 66% higher than the same week 48 in 2022 & still 17.4% higher YTD in 2024 compared to YTD 2023.
· % of Homes exchanging vs homes unsold - Of the 1,438,852 UK homes that left UK Estate Agents books since the 1st Jan 2024, 772,292 of them (53.67%) exchanged & completed contracts (meaning the homeowner moved and the estate agent got paid). The remaining 666,560 (46.33%) were withdrawn off the market, unsold. In essence you a flip of the coin chance of actually selling, homeowners moving and the estate agent getting paid.
If you would like to chat about our local property market, feel free to call me on 07970203228 or send me an email tony@millbanks.com