We are selling!
We've had another fantastic end to this month! Here are our latest properties we have agreed sales on.
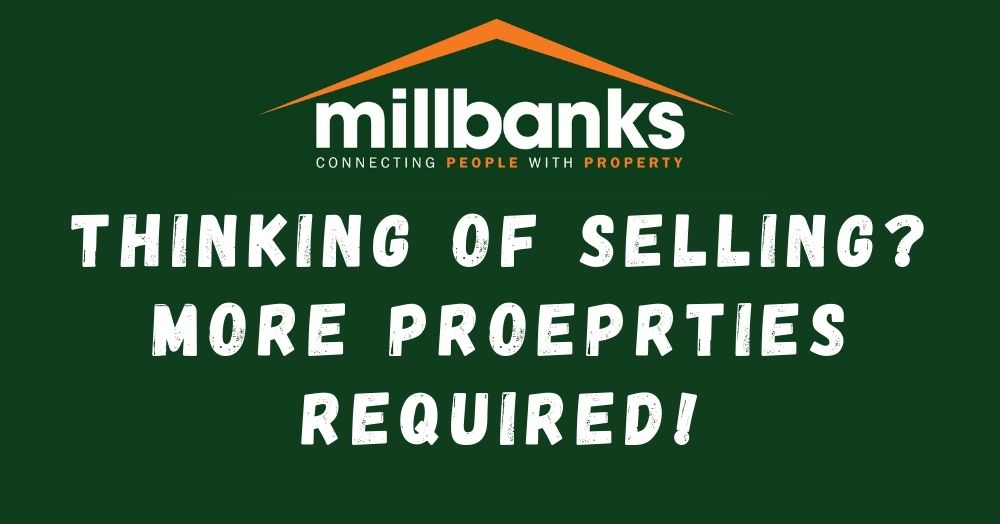
If you are thinking of selling, do give us a call on 01953 453838. We look forward to speaking with you!


