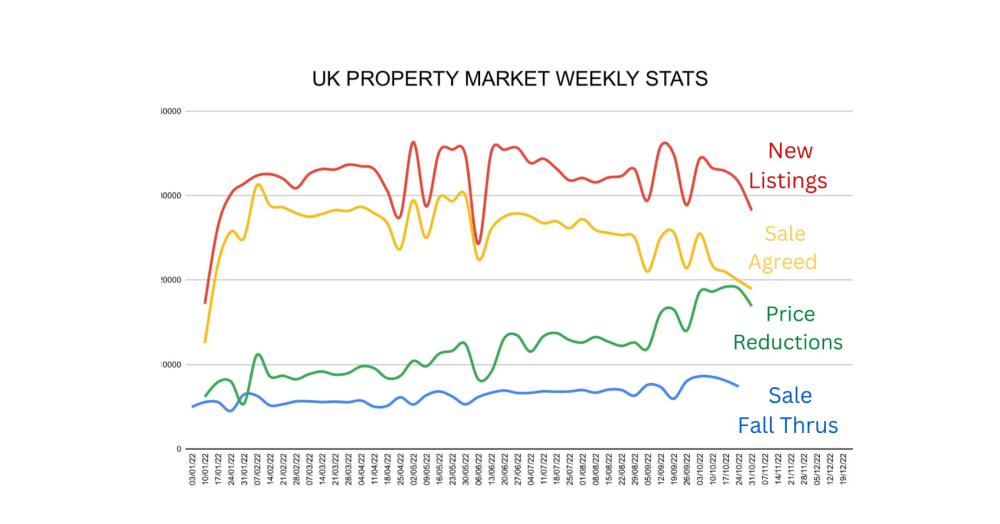
UK WEEKLY PROPERTY STATS - number of sales and new listings dipping (as expected).
These statistics illustrate that the property market is slowing down however, this was the same picture in November 2021 where the drop off occurred in Nov wk3 for the Christmas 🎄 break. This is back to a more normal market although there are certainly challenges ahead.
Source: Twenty EA