What’s the Going Rate for a Detached Home in Attleborough?
Detached homes remain highly sought-after in and around Attleborough, thanks to their space, flexibility, and access to local schools and transport. While averages offer a useful guide, a home’s true value depends on its size, condition, location, and how it’s presented to the market.
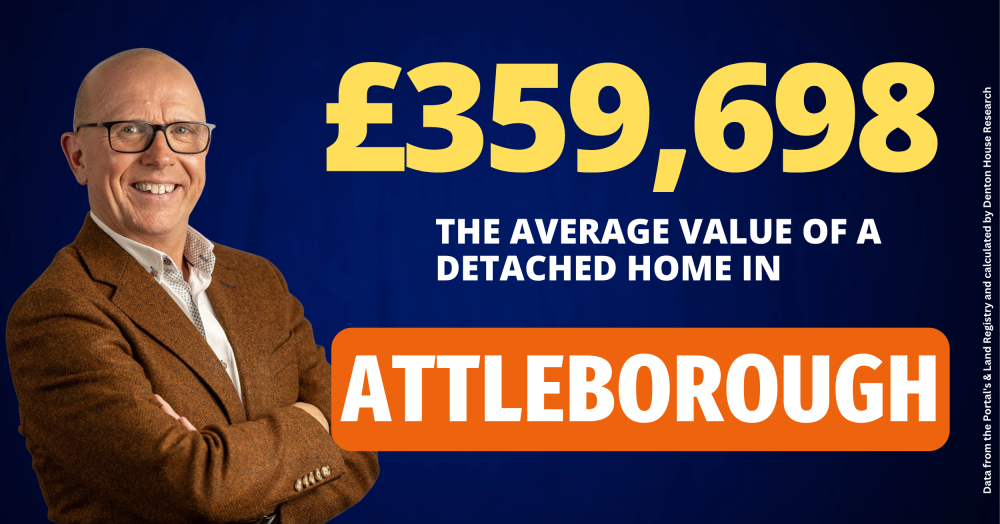
Detached homes continue to be one of the most sought- after property types in and around Attleborough and the latest data puts the average value at £359,698.
That figure, calculated using Land Registry and portal data by Denton House Research, offers a clear benchmark for buyers and sellers alike. Whether you’re considering upsizing, relocating, or selling a family home, it’s important to understand what the market is actually doing, not just what the asking prices say.
Detached homes in Attleborough tend to offer space, flexibility, and good access to local schools and transport links, which is why they remain in high demand. But averages only tell part of the story. The real value of your home depends on its size, condition, location, and how it’s marketed.
That’s where local Attleborough property knowledge makes all the difference.
If you’d like a no-pressure, evidence-backed opinion on what your Attleborough home might be worth in today’s market, not just what it could be listed for, I’d be happy to help.
I live and work in the Attleborough area. I understand the numbers. And more importantly, I understand what they mean for people like you.
Let’s have a chat when you’re ready or drop me a message. I know the local Attleborough property market inside out and I'm always happy to share what we’re seeing.
Call me anytime on 07970 203228, the office on 01953 453838, or email tony@millbanks.com With over 41 years of experience in property sales and marketing, I’m can offer clear guidance and support every step of the way.
Thank you for reading.