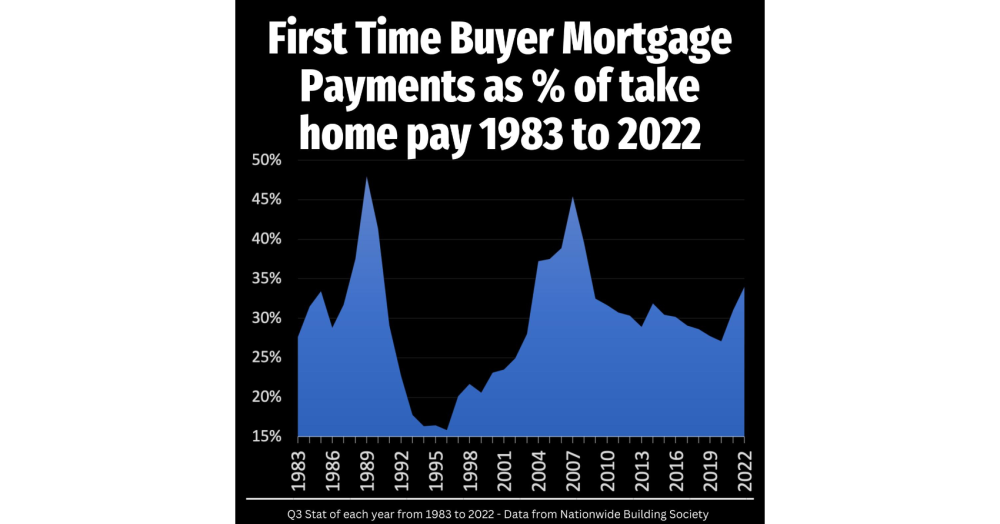
Would you believe it is cheaper today to buy a house as a first time buyer than in 1989 and 2007?
Yes it amazed us!
It just shows how much the newspapers spin things for bad news.
Of course the graph is going upwards, and it will be higher in Q4 - but interest rates need to rise 3% to 4% from where they are NOW to reach the levels of 1989 and 2007.
Yes it’s tough out there - but it isn’t end of the world.
Tell us your thoughts