
Despite the headlines, the property market is proving far more resilient than many expect. Sales are continuing, buyers remain active, and well-priced homes are still attracting strong interest. The difference today is that success depends on strategy, with realistic pricing now more important than ever.

The Attleborough property market may seem constantly on the move, but appearances can be deceiving. New analysis reveals that just one in three homes has sold more than once in the last 30 years, highlighting a fascinating divide between the properties that change hands regularly and those that remain with the same owners for decades.
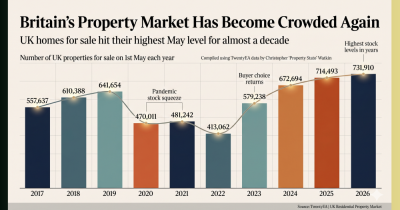
The property market remains active, but more homes for sale means buyers have greater choice and higher expectations. For Attleborough homeowners, a successful sale now depends less on simply listing a property and more on getting the pricing strategy right from day one.

The housing market is often portrayed through city skylines and rural escapes, but the reality is much more familiar. Most moves happen in suburban neighbourhoods, among everyday homes shaped by families, life changes and local demand. Understanding this market is key to making confident decisions when buying or selling.

Scrolling property portals is useful, but registering with an estate agency can give buyers a more personal, proactive search experience, especially when the right home is about to come to market.

It may feel far too early to think about Christmas, but moving home takes longer than many sellers expect. Starting in July can make the journey calmer and more controlled.

As school holidays approach, family buyers often become more focused. For sellers with space, gardens or flexible rooms, July can be a useful moment to attract motivated movers.

The rental market continues to shift, with new rules, rising rents and affordability pressures all shaping landlord decisions. July is a good time to review your property and your plans.
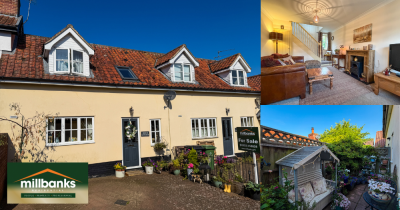
Charming 2-Bed Cottage Enjoying a Pleasant Mews Position with Car Parking and Enclosed Patio Garden.
A delightful 2-bedroom modern cottage-style mid-terrace cottage in a desirable mews location in well served village of East Harling. Featuring a cosy sitting room, a well-appointed kitchen/breakfast room, and an enclosed patio garden with off-road parking, it offers comfortable living in a pleasant non-estate village setting.

Discover this appealing 4-bedroom link-detached family home in a desirable non-estate position in the pleasant small town of Hingham. Enjoy the convenience of walking distance to the village pub, shops and primary school, this property offers a generous living space, a wonderful setting and excellent potential for growing families

Discover this stylish three-bedroom detached home built by Messrs Abel Homes offering modern design, energy efficiency, and generous living. Set on a sunny 0.21 of acre corner plot, it features an open-plan kitchen/diner, dual-aspect lounge, study, utility, en suite, and a fabulous garden with patio, garage, and solar panels in East Harling.

Sir Keir Starmer’s resignation has added fresh uncertainty to the UK property market, but its impact will depend less on politics and more on how financial markets react to the next government’s economic plans. Mortgage rates, taxation and buyer confidence could all be influenced by what comes next. Please click the link to learn more