Asking Price vs Sale Price - What Attleborough Sellers Need to Know
Setting the asking price is a key decision when selling a home. Data from the past two years shows that, on average, UK homes sell for less than their original asking price—revealing a consistent trend where final sale prices often fall short of initial expectations.
Setting the asking price is one of the most important decisions you make when selling a home.
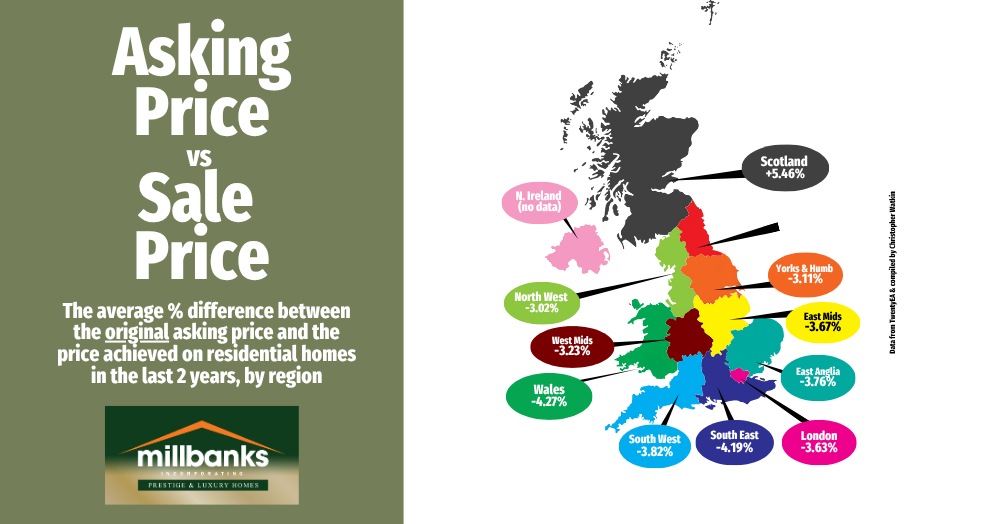
This data reveals the average difference between the original asking price and the final sale price achieved over the past two years for UK house sales. It highlights a clear trend across the UK where most homes sell for less than their initial asking price. Yet averages only tell part of the story.
• Scotland: +5.46%
• North East: -2.73%
• Yorks & Humber: -3.11%
• North West: -3.02%
• West Midlands: -3.23%
• East Midlands: -3.67%
• London: -3.63%
• East Anglia: -3.76%
• South West: -3.82%
• South East: -4.19%
• Wales: -4.27%
It must be noted that Scotland has slightly different way of buying property as homebuyers often bid over the asking price, not under … a key distinction.
In England & Wales, realistic pricing is the key to success. This doesn’t mean pricing high at the start never works. Sometimes a seller lands a dream buyer and achieves more. And here’s another important number…
✔ If your property sells (sold stc) within the first 25 days, there's a 94% chance it’ll go on to exchange and complete (ie you move home)
✖ If it takes more than 100 days to sell, that figure falls to just 56%.
Yes, you can try a higher asking price. But if you haven’t had strong interest or offers within the first few weeks, it’s not a sign to wait longer, it’s a sign to act.
If you're based in Attleborough and the surrounding area and your thinking about selling as we enter the 2nd half of the year, now could be a great time to have a chat.
Call me on 07970203228 or (01953) 453838 for a straightforward, no pressure conversation about your options and the strategies I offer.