Attleborough Property Market: March 2008 vs March 2024
The current property landscape in Attleborough presents a striking contrast to the story back in March 2008. Back in the Spring of 2008, the Attleborough property market was flooded with homes for sale, causing houses prices to drop throughout 2008.
The current property landscape in Attleborough presents a striking contrast to the story back in March 2008. Back in the Spring of 2008, the Attleborough property market was flooded with homes for sale, causing house prices to drop throughout 2008.
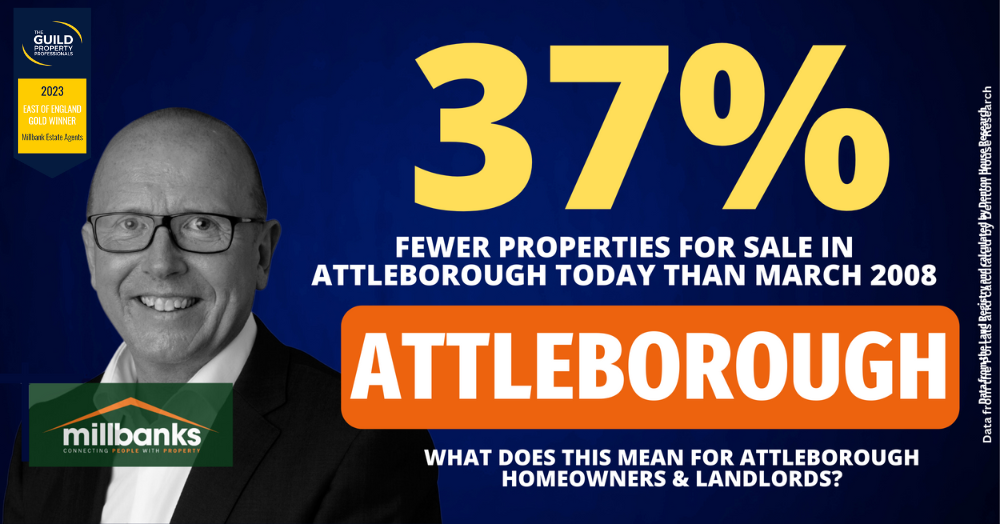
Today there are 37% fewer Attleborough homes available on the market today.
This means there is more of an equilibrium in the Attleborough property market, which will foster a more stable environment for property prices. This tightening of supply means that demand is more closely matched with availability, reducing the likelihood of drastic price fluctuations.
For Attleborough homeowners and prospective buyers, this could signal a period of relative stability in the property market, making it an opportune time to consider long-term investment decisions.
This trend underscores the dynamic nature of the property market, where supply levels play a crucial role in shaping price stability and market health.