HOUSEHOLD MAKE UP
The composition of UK households has undergone significant changes between 1996 and 2023. These shifts, though often subtle, highlight meaningful trends in demographics and society, offering insights into how the nation’s living arrangements continue to evolve.
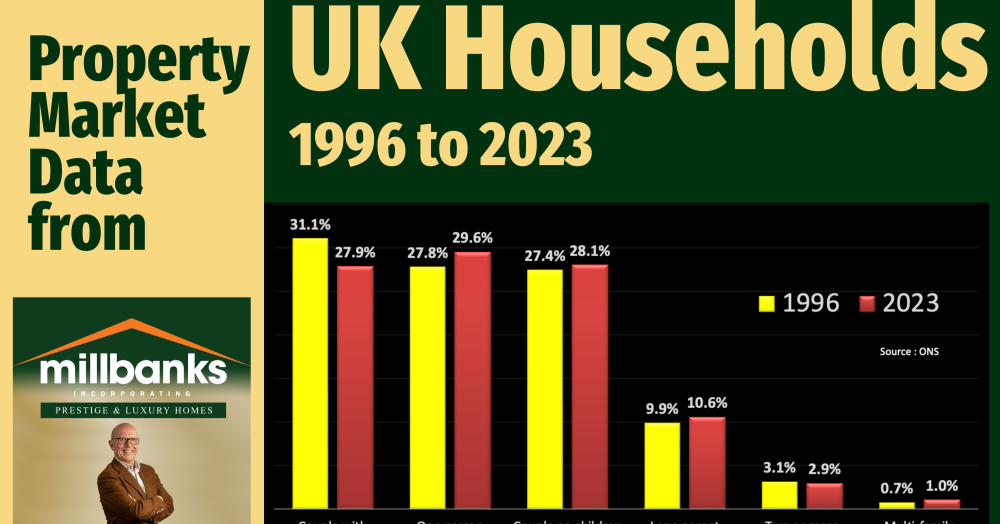
The composition of UK households has evolved significantly between 1996 and 2023, with some subtle yet meaningful proportional shifts that reflect changing demographics and societal trends.
For couples with children, their share of total households has dropped from 31.1% in 1996 to 27.9% in 2023, a proportional decrease of approximately 10.3%. This reflects lifestyle changes, including delayed parenthood and smaller family sizes.
In contrast, one-person households have risen from 27.8% to 29.6%, a proportional increase of 6.5%. This growth likely reflects an ageing population, as well as more individuals choosing to live alone due to greater financial independence or personal preference.
Couples without children have seen a smaller proportional increase, rising from 27.4% to 28.1%, an increase of just 2.6%. This stability underlines the continuing trend of dual-income households and couples choosing alternative priorities to raising children.
Lone-parent households, meanwhile, have grown from 9.9% to 10.6%, a proportional rise of 7.1%.
Interestingly, households with two or more unrelated adults have seen a proportional decline of 6.5%, decreasing from 3.1% to 2.9%, potentially reflecting challenges such as rising housing costs or changing rental practices.
Multi-family households, although still rare, have increased from 0.7% to 1.0%, a proportional jump of 42.9%, likely driven by economic pressures and the resurgence of multigenerational living. These proportional changes, though subtle, provide insights into the UK’s shifting household dynamics.
For towns like Attleborough, they highlight the importance of tailored housing policies and estate agency services that respond to evolving needs, including single-person housing, multigenerational homes, and affordability concerns.
This information is important for lots of people; including national and local government for the provision of services and future housing, buy-to-let investors knowing what sort of demand there will be different types of properties in the future and finally any homeowners wanting to know how demographic changes will affect the property market and house prices in the long term.
These are my thoughts. Please share with in the comments your thoughts on this