Houses Sales 2026 vs 2024
The early months of 2026 suggest a UK housing market finding its rhythm, with buyer activity strengthening across most regions. While growth varies from place to place, the wider picture is one of steady progress rather than sharp change. To learn what this means closer to home, read on.
The first two months of 2026 showed a housing market that is quietly gathering momentum across much of the UK.
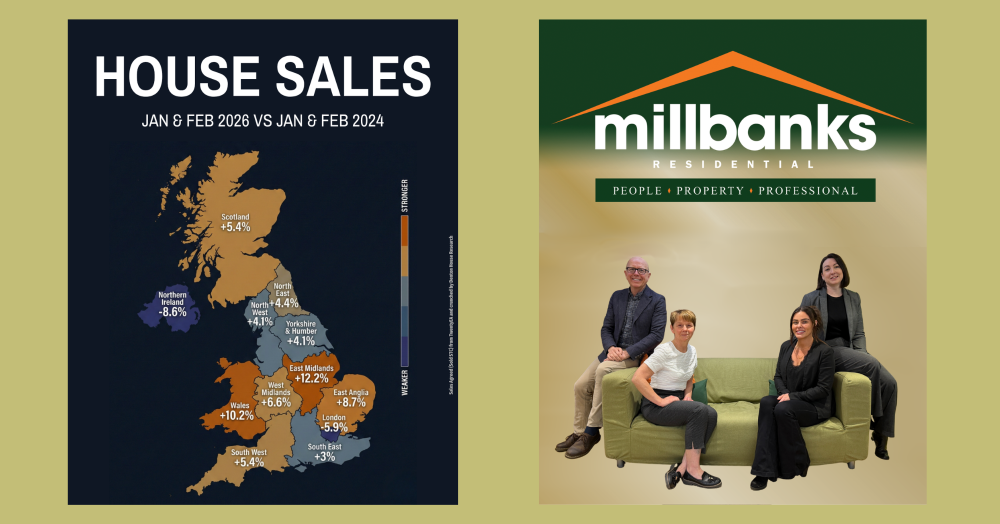
Comparing January and February 2026 with the same period in 2024, most regions have seen an increase in the number of homes sold subject to contract. In fact, 10 of the 12 UK regions recorded more agreed sales.
The East Midlands leads the way with a 12.2% rise, followed by Wales at 10.2% and East Anglia at 8.7%. Elsewhere, the market is seeing steady growth rather than dramatic jumps. West Midlands sales are up 6.6%, while Scotland and the South West are both up 5.4%. The North East has risen by 4.4%, and both the North West and Yorkshire and the Humber are up 4.1%.
The South East has seen a more modest increase of 3%, but still remains in positive territory. Two regions have moved in the opposite direction. London is down 5.9%, while Northern Ireland has seen a larger fall of 8.6% in agreed sales.
What this tells us is that buyer activity has strengthened in many parts of the country, although markets are never perfectly aligned and local conditions can vary considerably from place to place.
And that is the key point.
National headlines are interesting, but what really matters is what is happening in our Attleborough property market and to homes like yours.
If you are curious about how the value of your Attleborough home may have changed since you bought it, or simply want an update on the local market, We are always happy to help. Feel free to get in touch for a free, no obligation market appraisal , even if you are planning to move for a while
If you'd like to find out what your home might be worth in 60 Seconds, please 'click' the banner ad below