New Price!
This lovely, charming detached 3 bedroom cottage in Rockland St Peter with no onward chain has a new price! Why don't you take a look?
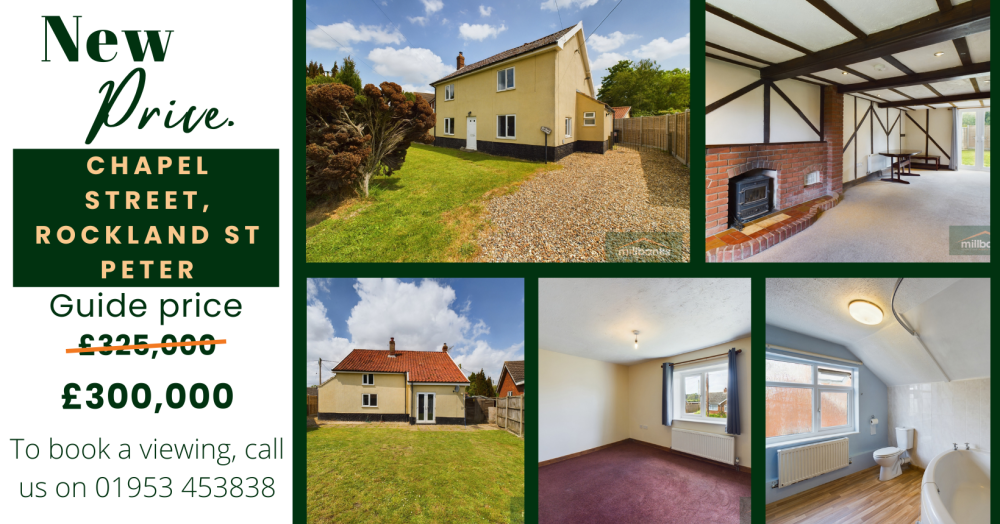
This charming character cottage is situated in a popular village setting and boasts some exposed beams throughout. The lounge features a cosy wood burner, perfect for those chilly winter evenings, while the separate dining room provides ample space for entertaining guests. The peaceful rear garden offers a tranquil escape, and the bathroom and three bedrooms provide plenty of space for a family or guests. There is also a convenient ground floor cloakroom. Best of all, this lovely cottage is being sold with no onward chain, making it the perfect opportunity for those looking for a hassle-free move. Don't miss out on the chance to make this delightful cottage your new home!
Click the link below to take a closer look