The UK Property Market Stats Update for the week, finishing Sunday, the 30th March 2025.
This week's update provides a statistical analysis, offering insights into what’s happening and shaping the UK Property Market, for week finishing Sunday, the 30th March 2025.
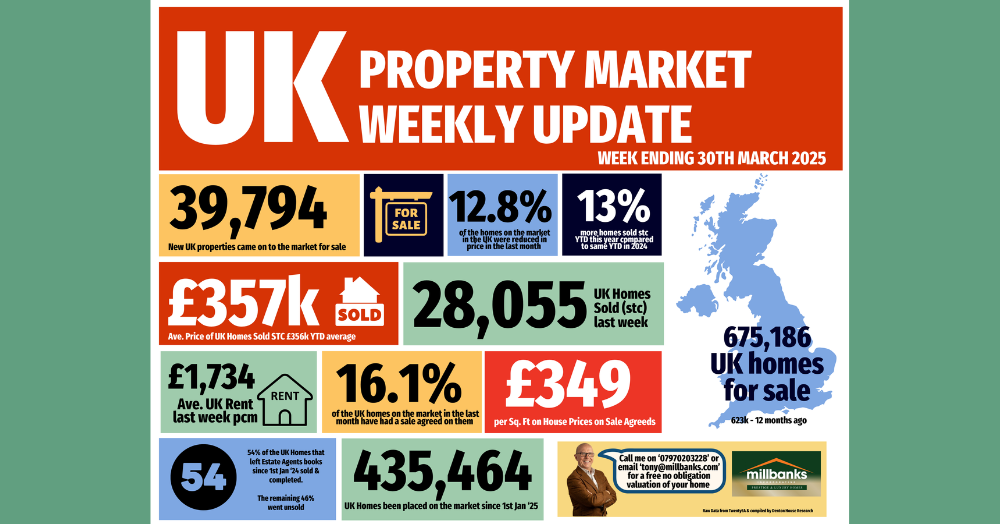
✅ Listings (New Properties on the Market)
39.7k new listings this week (last week 38.4k)
That’s 7% higher than Week 12 of 2024 YTD and 10% higher YTD compared to 2017/18/19.
✅ Price Reductions (% of Resi Stock)
24k Price Reductions this week - meaning an approx run rate of 1 in 8 of Resi Sales stock per month is being reduced (12%).
For comparison, 12.1% average in 2024, though the long-term 5-year average is 10.6%.
✅ Total Gross Sales (Agreed Sales)
28.1k UK homes sold STC this week, up from 27.1k last week in Week 11
That’s 13% higher YTD compared to 2024 and 23% higher than 2017/18/19 YTD levels.
✅ Sale-Through Rate (Monthly in Arrears)
Last months sale run rate of 16.2% of Resi stock sold stc (ie 16.2% of Estate Agents properties on the market went sale agreed). 2024 monthly average: 15.3%. Long-term 8-year average: 17.9%.
✅ Sale Fall-Throughs
6,315 Sale fall-thrus last week from Resi Sale Sales Pipeline of 451,074 homes sale agreed (sold stc).
Another method is that week’s sale fall thrus as a % of gross sales that week. This week, that is 22.5% (last week 23.2%). Just above the 7-year average of 24.2%, yet well below the 40%+ levels post-Truss Budget (Autumn 2022).
Last month, as a whole, 5.48% of sales in the UK agents pipelines fell thru. For comparison, 2024 average: 5.36%.
✅ Net Sales (Gross sales for the week less Sale Fall Thrus for the week)
21.7k net sales this week (20.8k last week), compared 2025 weekly average of 19.7k.
2025 YTD is 12% higher than compared to 2024 YTD and 18% higher than YTD 2017/18/19.
Stats compiled by Property 'Stato' Chris Watkin using Twenty EA Data
If you’re interested to move and want a reliable, professional approach to selling your home in 2025, I'm here to help. Let's work together to make your property stand out in Attleborough's market, and attract motivated buyers to ensure a smooth sale from start to finish.
Get in touch with me today to learn more about my tailored advice and marketing strategy to sell your Attleborough home.
𝗖𝗮𝗹𝗹 𝗺𝗲 𝗼𝗻 (𝟬𝟭𝟵𝟱𝟯) 𝟰𝟱𝟯𝟴𝟯𝟴 𝗼𝗿 𝟬𝟳𝟵𝟳𝟬𝟮𝟬𝟯𝟮𝟮𝟴 𝗼𝗿 𝗱𝗿𝗼𝗽 𝗺𝗲 𝗮𝗻 𝗲𝗺𝗮𝗶𝗹 𝘁𝗼 𝘁𝗼𝗻𝘆@𝗺𝗶𝗹𝗹𝗯𝗮𝗻𝗸𝘀.𝗰𝗼𝗺
🏡🏠🏘️ #PersonalAgent #PropertyProfessionals #HelpingPeopleMoveHome